
Figures & data
Scheme 1. Synthetic schemes. A. An acyl substitution strategy was employed to generate thiocholine derivatives. The acyl chloride was mixed with 2-(dimethylamino)ethanethiol hydrochloride, triethylamine, and dichloromethane to afford the corresponding thioester. The quaternary amine was produced from reaction with methyl iodide in THF. B. An acyl substitution strategy was used to generate the piperidinyl and pyrrolidinyl derivatives. The appropriate acid chloride was mixed with the N-methylpiperidinol, R or S N-methylpyrrolidinol in dichloromethane and triethylamine to produce the ester/thioester. The ammonium salt was formed by reaction with HCl or oxalic acid. Legend: p-FPh = para-fluorophenyl; p-IPh = para-iodophenyl.
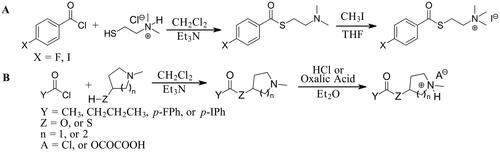
Table 1. Catalytic parameters (kcat, Km, and kcat/Km) of substrate hydrolysis by AChE and BChE.
Figure 1. Representative photomicrographs showing staining of plaque pathology for Aβ immunohistochemistry (A, D) and AChE (B, E) and BChE (C, F) histochemistry at pH 6.8 in the cerebral cortex of human AD (A-C) and 5XFAD mouse (D-F) brain tissues. Insets are higher magnification photomicrographs showing examples of plaque pathology. Note the similarities in the cortical plaques stained for Aβ, AChE, and BChE. Scale bars = 200 µm, insets = 10 µm.
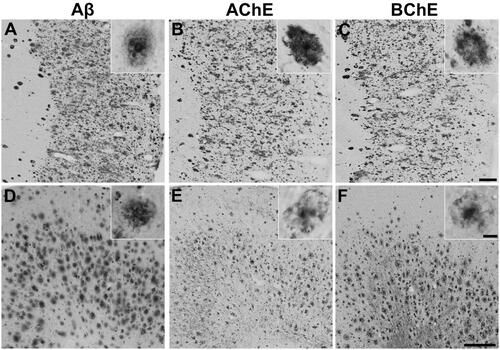
Figure 2. Representative photomicrographs of histochemical staining at pH 6.8 in human orbitofrontal cortex sections. The sections were from the same brain to illustrate staining patterns demonstrating the intensity of ChE staining of AD pathology using thioesters (A-D) and the reduction of staining intensity for BChE at pH 6.8 by ester compounds (E-H). Thioester staining intensity, summarised in , was categorised as (A) o (no staining), (B) + (weak), (C) ++ (moderate), or (D) +++ (strong). The reduction in staining by esters, also summarised in , was categorised as (E) – (no inhibition), (F) x (slight), (G) xx (moderate) or (H) xxx (strong). Scale bar = 400 µm.
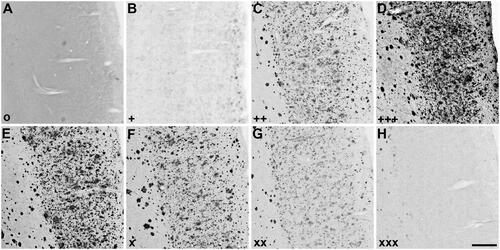
Figure 3. Representative photomicrographs of histochemical staining at pH 6.8 in 5XFAD mouse cerebral cortex sections demonstrating the intensity of ChE staining of AD pathology using thioesters (A-D) and the reduction of staining intensity for BChE at pH 6.8 by ester compounds (E-H). Thioester staining intensity, summarised in , was categorised as (A) o (no staining), (B) + (weak), (C) ++ (moderate), or (D) +++ (strong). The reduction in staining by esters, also summarised in , was categorised as (E) – (no inhibition), (F) x (slight), (G) xx (moderate) or (H) xxx (strong). Scale bar = 200 µm.
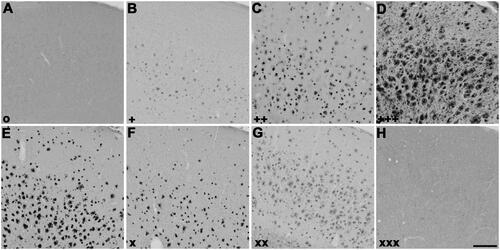
Figure 4. Photomicrographs of histochemical staining in human brain tissues demonstrating the hydrolysis of thioesters by ChEs at pH 6.8 or 8.0 (columns 1 and 2) or the reduction in AChE and BChE staining in the presence of esters (columns 3–6). Note, positive control staining of tissue (i.e. AChE or BChE staining at pH 6.8 and 8.0) is provided in the 1st row of columns 3–6. Note, histochemical staining at pH 6.8 demonstrated ChE activity associated with Aβ plaques while that at pH 8.0 is associated with neural elements. Staining with thioester compounds allowed for a direct visualisation of the kinetic interaction of the compound with ChEs. The degree to which staining for AChE or BChE activity was reduced by the presence of esters provided indirect evidence that the compound interacted with the enzyme targets. Scale bar = 400 µm.
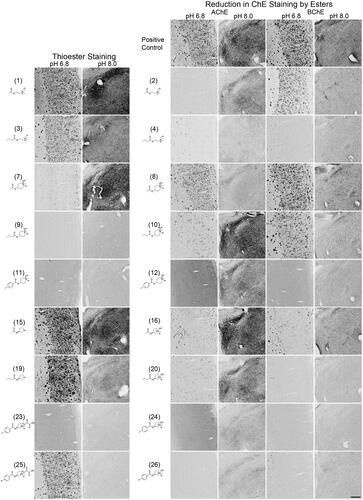
Figure 5. Photomicrographs of histochemical staining in mouse brain tissues demonstrating the hydrolysis of thioesters by ChEs at pH 6.8 or 8.0 (columns 1 and 2) or the reduction in AChE and BChE staining in the presence of esters (columns 3–6). Note, positive control staining of tissue (i.e. AChE or BChE staining at pH 6.8 and 8.0) is provided in the 1st row of columns 3–6. Note, histochemical staining at pH 6.8 demonstrated ChE activity associated with Aβ plaques while that at pH 8.0 is associated with neural elements. Staining with thioester compounds allowed for a direct visualisation of the kinetic interaction of the compound with ChEs. The degree to which staining for AChE or BChE activity was reduced by the presence of esters provided indirect evidence that the compound interacted with the enzyme targets. Scale bar = 200 µm.
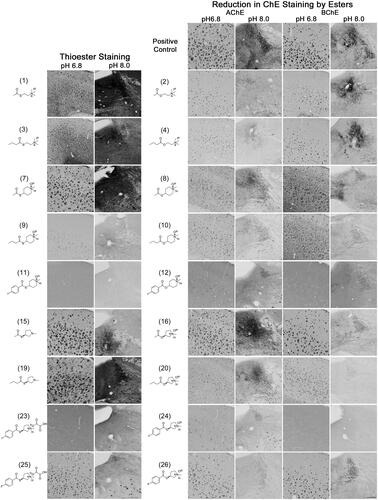
Table 2. Qualitative analysis of the thioester and ester staining results with the Karnovksy-Roots (KR) histochemical staining method in human (round brackets) and mouse [square brackets] brain tissues. Intensity of thioester staining with the KR method was categorised as: o (no staining), + (weak), ++ (moderate) or +++ (strong); as shown in . The inhibition in AChE or BChE staining resulting from ester substrate competition was categorised as: – (no inhibition), x (slight), xx (moderate) or xxx (strong); as depicted in . ND = not done.
Supplemental Material
Download PDF (11.1 MB)Availability of data and materials
The data that support the findings of this study are available from the corresponding author, SD, upon reasonable request.