Figures & data
Figure 1. Structures of representative ROS1/ALK dual inhibitors.
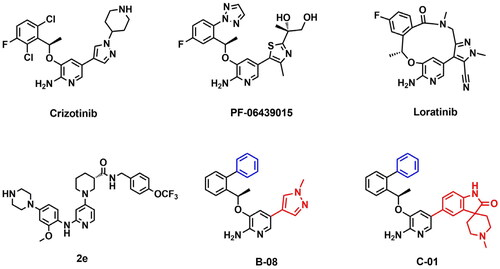
Figure 2. Design strategies of target compounds based on cocrystal structures of Crizotinib with ROS1WT (PDB 3ZBF) and ALKWT (PDB 2XP2). (A) Docking structure of Crizotinib binding to apo-G2032R ROS1 receptor. (B) Docking structure of Crizotinib binding to apo-G1202R ALK receptor. (C) 2D structure of Crizotinib. (D) Docking posture of Crizotinib binding to ROS1 receptor. (E) Design strategies for novel 2-aminopyridine analogues as ROS1/ALK dual inhibitors. (For interpretation of the references to colour in this figure legend, the reader is referred to the Web version of this article).
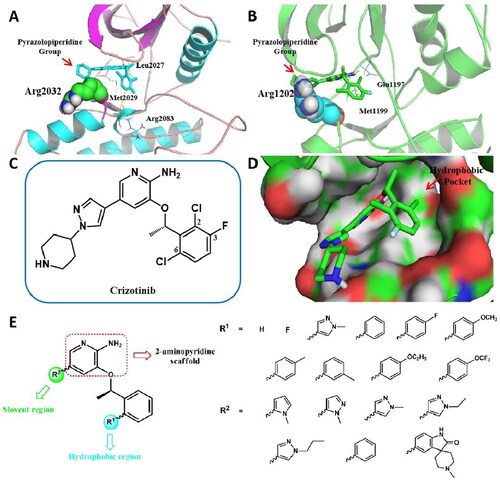
Figure 3. (A–C) General synthetic routes of 2-aminopyridine derivatives. Reagents and conditions: (i) (-)-DIP-Cl, THF, −35 °C, 3 h, rt, 18 h; (ii) diethanolamine, TBME, 60 °C, reflux, 1 h, rt, 2 h; (iii) DIAD, PPh3, 2-nitropyridin-3-ol, dry THF, 0 °C, 8 h; (iv) Fe, AcOH, EtOH, 85 °C, reflux, 2 h; (v) NBS, MeCN, 0 °C, 30 min; (vi) potassium carbonate, Pd(PPh3)4, DOX, H2O, 85 °C, 8 h.
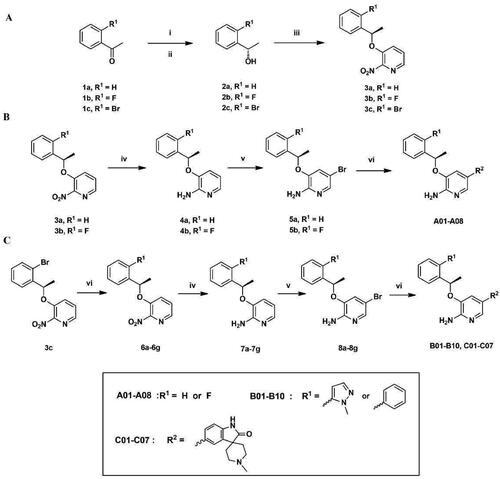
Table 1. The enzymatic and anti-proliferative activities of target compounds A01–A08.
Table 2. The enzymatic and anti-proliferative activities of target compounds B01–B10.
Table 3. The enzymatic and anti-proliferative activities of target compounds C01–C07.
Figure 4. In vitro activities against Crizotinib-resistant ROS1G2032R and ALKG1202R mutants. Dose–response curves for proliferation of Ba/F3 CD74-ROS1WT cell (A), Ba/F3 CD74-ROS1L2026M cell (B), Ba/F3 CD74-ROS1G2032R cell (C), Ba/F3 EML4-ALKWT cell (D) and Ba/F3 EML4-ALKL1196M cell (E) after 72 h exposure to B08, C01–C03, and Crizotinib. (F) Enzyme-based activities of B08, C01, C02, and Crizotinib against ALKG1202R mutant. All data are the average of n ≥ 2 ± standard deviation.
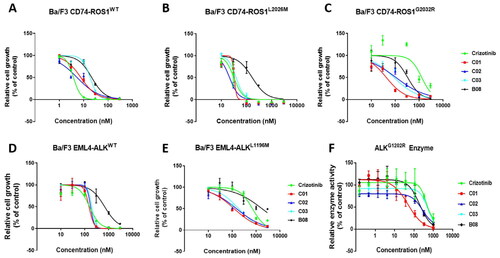
Table 4. Enzymatic and cellular activities to ROS1 and ALK mutants.
Figure 5. Inhibition of cellular phosphorylation of ROS1, ALK, and ERK by C01 in CD74-ROS1WT (A), CD74-ROS1L2026M (B), CD74-ROS1G2032R (C), and EML4-ALKL1196M (D) cells investigated by western blot analysis, with Crizotinib as the positive control. Cells were treated with Crizotinib or C01 at the indicated concentrations for 4 h and the levels of protein were evaluated by western blot analysis of cell lysates using specific antibodies.
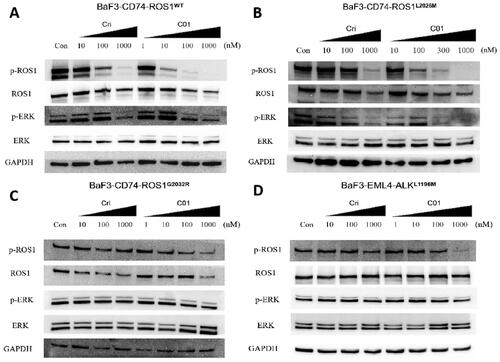
Figure 6. (A) Flow cytometric analysis of apoptosis in HCC-78 cell line treated with C01 in the concentrations of 0 (control), 2.0 μM, 3.9 μM, and 7.8 μM. (B) Graphical representation of total percentage of apoptosis induced by C01 in HCC-78 cell line. (C) Flow cytometric analysis of apoptosis in NCI-H3122 cell line treated with C01 in the concentrations of 0 (control), 1.5 μM, 3.0 μM and 6.0 μM. (D) Graphical representation of total percentage of apoptosis induced by C01 in NCI-H3122 cell line. (*p < 0.05; **p < 0.01; ***p < 0.001 vs control, n = 3).
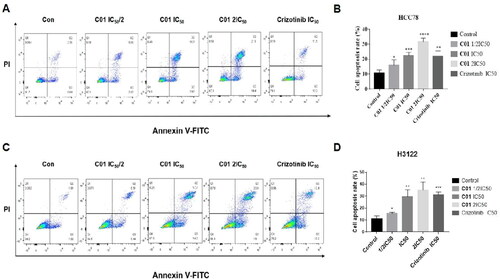
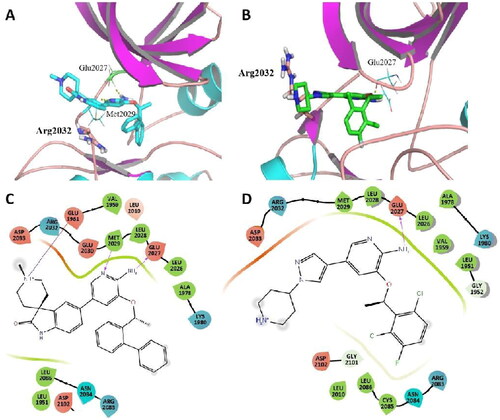
Figure 7. Representative structures from MD simulation of C01 (A) and Crizotinib (B) in the active site of ROS1G2032R. (ROS1 in coloured cartoon, ligands, and residues in stick mode. Yellow dots represent hydrogen bonds). (For interpretation of the references to colour in this figure legend, the reader is referred to the Web version of this article.) (C) 2D diagram of the interaction between C01 and the binding site of ROS1G2032R. (D) 2D diagram of the interaction between Crizotinib and the binding site of ROS1G2032R.