Figures & data
Table 1. Inhibition data of CA I and CA II with compounds reported here and the standard sulphonamide inhibitor acetazolamide (ACTZ) by a stopped-flow CO2 hydrase assay.
Figure 1. A 2D plot illustrating the interaction of ACTZ and compound 1 with human carbonic anhydrase II (PDB: 5E2M). The plot depicts the common interacting residues between the two ligands as red circles, hydrophobic interactions as arcs with red spikes, and H-bonding interactions as dashed green lines. The plot uses colour coding to distinguish between different atoms and bonds, with carbon atoms in black, oxygen atoms in red, nitrogen atoms in blue, sulphur atoms in yellow, and chloro atoms in green. The bonds of the amino acid residues are coloured brown, while the ligands are coloured violet. The zinc ion is presented in pink.
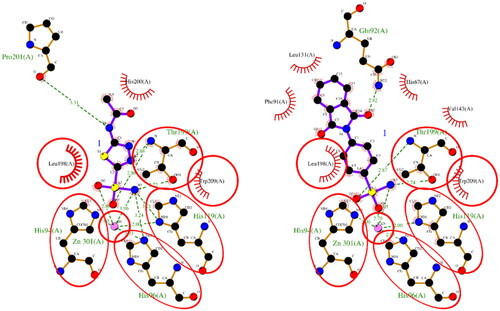
Figure 2. A 2D plot illustrating the interaction of ACTZ and compound 1 with human carbonic anhydrase II (PDB: 5MJN). The plot depicts the common interacting residues between the two ligands as red circles, hydrophobic interactions as arcs with red spikes, and H-bonding interactions as dashed green lines. The plot uses colour coding to distinguish between different atoms and bonds, with carbon atoms in black, oxygen atoms in red, nitrogen atoms in blue, sulphur atoms in yellow, and chloro atoms in green. The bonds of the amino acid residues are coloured brown, while the ligands are coloured violet. The zinc ion is presented in pink.
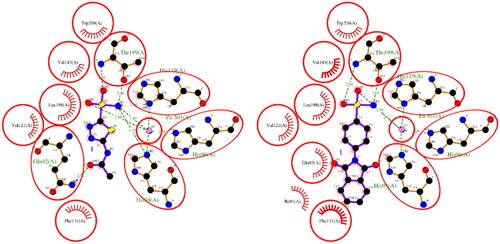
Figure 3. A 2D plot illustrating the interaction of ACTZ and compound 1 with AF-A0A1S4EX12 (AlphaFold structure). The plot depicts the common interacting residues between the two ligands as red circles, hydrophobic interactions as arcs with red spikes, and H-bonding interactions as dashed green lines. The plot uses colour coding to distinguish between different atoms and bonds, with carbon atoms in black, oxygen atoms in red, nitrogen atoms in blue, sulphur atoms in yellow, and chloro atoms in green. The bonds of the amino acid residues are coloured brown, while the ligands are coloured violet. The zinc ion is presented in pink.
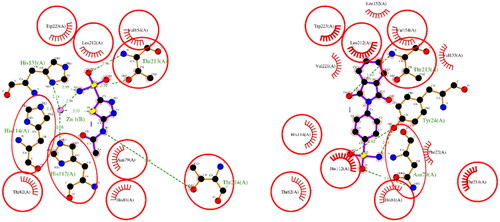
Table 2. Comparative docking data and key residue interactions of ligands ACTZ and compound 1 with human and mosquito carbonic anhydrases.
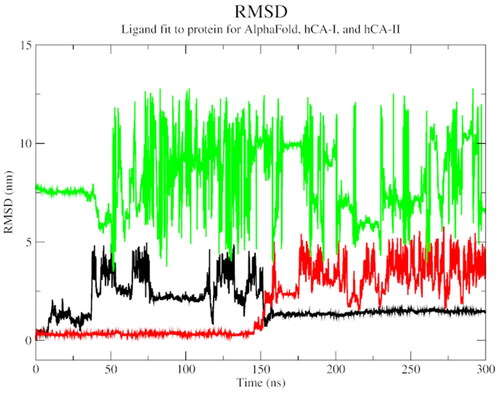
Figure 4. The root mean square deviation plot of AlphaFold (black), hCA I (red), and hCA II (green) with compound 1.
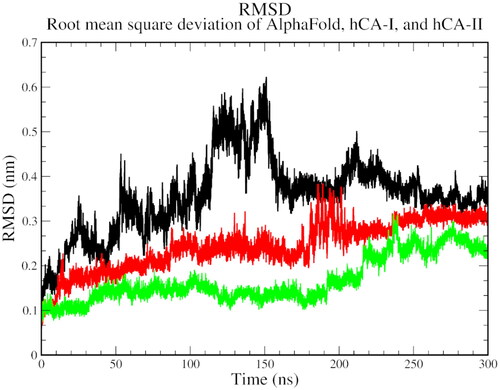
Figure 5. The root mean square fluctuation plot of AlphaFold (black), hCA I (red), and hCA II (green) with compound 1.
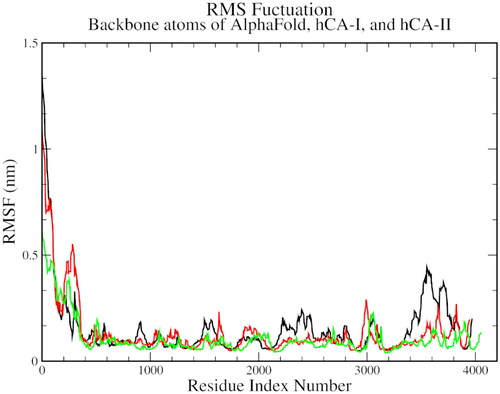
Figure 6. The radius of gyration plot of AlphaFold (black), hCA I (red), and hCA II (green) with compound 1.
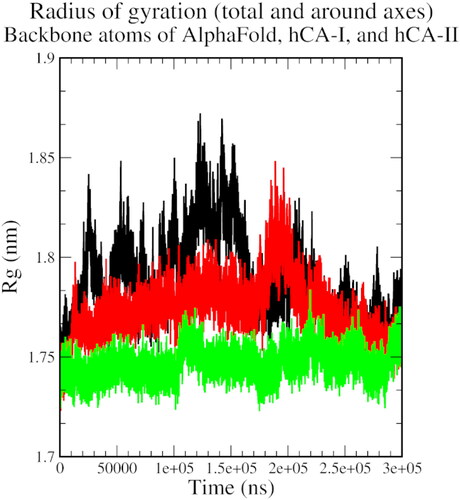
Figure 7. The solvent-accessible surface area plot of AlphaFold (black), hCA I (red), and hCA II (green) with compound 1.
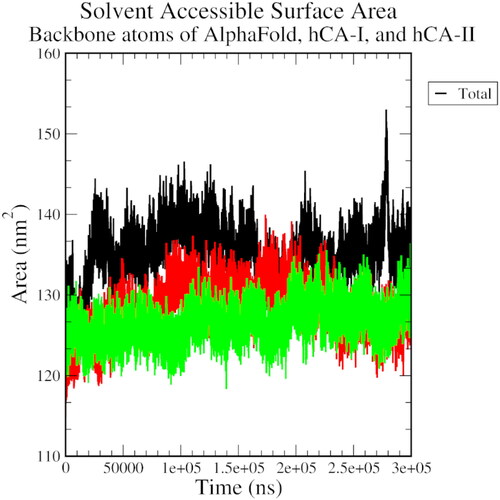
Figure 8. The RMSD plot of ligand fit to protein backbone of AlphaFold (black), hCA I (red), and hCA II (green) with compound 1.