Figures & data
Figure 1. The structure of isolated compounds from G. uralensis.
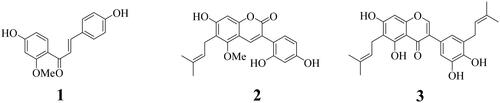
Figure 2. The inhibitory activity of compounds on SARS-CoV-2 3CLpro (A). The best pose (B) and docking results (C–E) between inhibitors (1: red, 2: yellow, 3: green) and 3CLpro (ID: 7END).
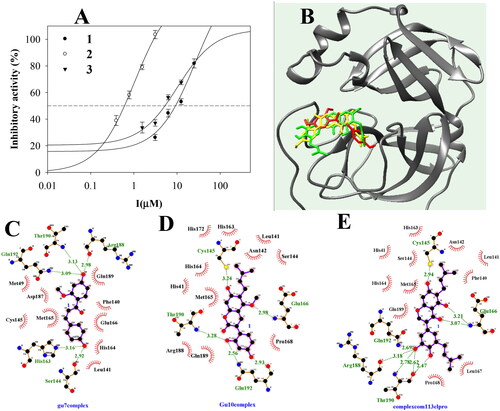
Table 1. The inhibitory activity and docking results of inhibitors towards SARS-CoV-2 3CLpro.
Figure 3. The superposition of inhibitors 1–3 with sEH for the 30 ns (red: 0 ns, orange: 3 ns, yellow: 6 ns, green: 9 ns, cyan: 12 ns, blue: 15 ns, conflower blue: 18 ns, purple: 21 ns, hot pink: 24 ns, magenta: 27 ns, black: 30 ns) (A-C). The RMSD (D), RMSF (E), and hydrogen bonds (F–H) of the simulation. The distance of key residues (I) with inhibitors 10 with sEH(J–L).
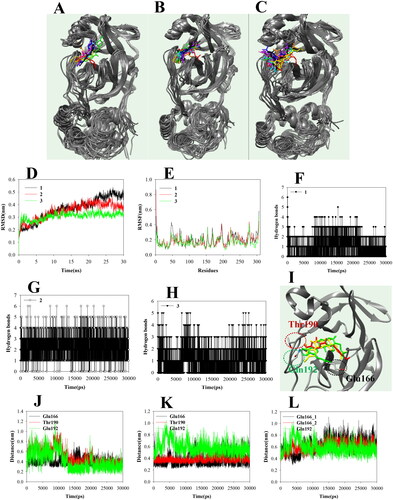
Figure 4. Compounds 1–3 treatment decreased HCoV-OC43-induced cytotoxicity. The cytotoxicity of compounds 1–3 was evaluated by MTT assay (A–C). RD cells were incubated with the indicated concentration of compounds 1–3 for 24 h. Compounds 1–3 treatment reduces the cytotoxicity of HCoV-OC43 infections (D–F). RD cells were infected with mock or HCoV-OC43 and cells were incubated with the indicated concentration of compound. Cell viability was evaluated with MTT assay.
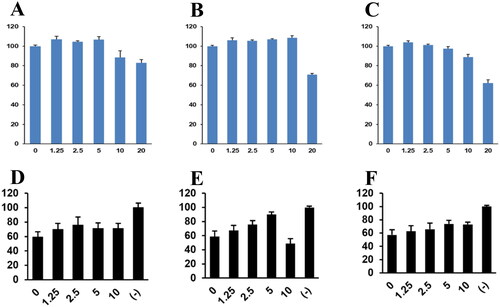
Figure 5. Compounds 1–3 inhibited the replication of HCoV-OC43 coronavirus. (A) Compounds 1–3 treatment decreased the expression of HCoV-OC43 protein in cells and media. RD cells were incubated with compounds 1–3 and infected with HCoV-OC43 (1 0 −3 dilution of conditioned media). Three days after infection, an equal amount of cell lysates (upper panel) and conditioned media (lower panel) were probed with anti-HCoV-OC43 antibody. (B) Compounds 1–3 treatment decreased the RNA level of HCoV-OC43 in media. RD cells were infected HCoV-OC43, and RNA was purified from the infected cell and media. The RNA level of RdRp gene, M gene and N gene was evaluated by quantitative RT-PCR.
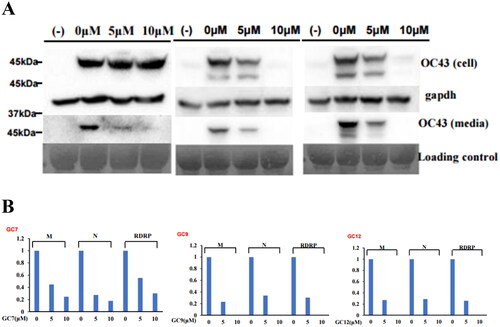
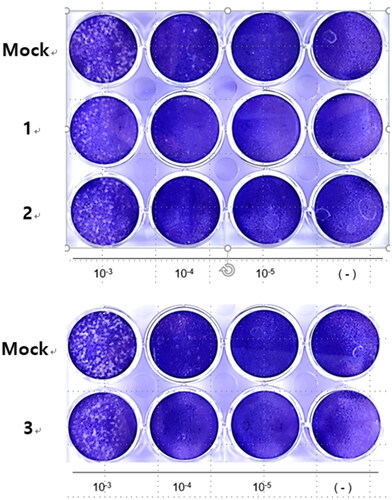
Figure 6. Compounds 1–3 reduced the number of plaque formation. RD cells were infected with HCoV-OC43 and cells were incubated with compounds 1–3. To visualise the plaque formation, the infected cells were stained with crystal violets.