Figures & data
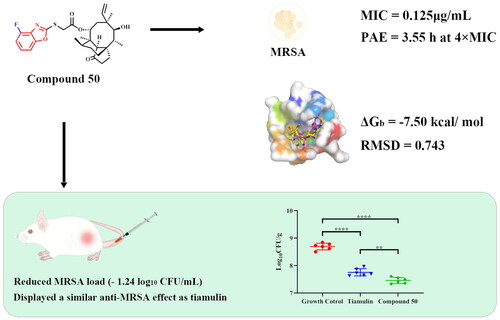
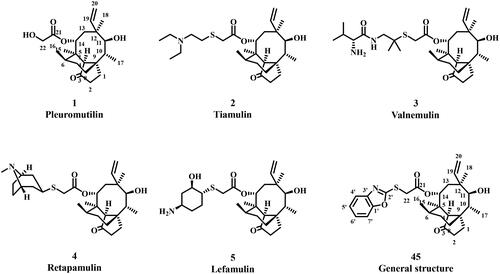
Figure 1. Structures of pleuromutilin (1), tiamulin (2), valnemulin (3), retapamulin (4), lefamulin (5), general structure (45).
Scheme 1. Reagent and conditions: (i) acetonitrile, p-toluenesulfonyl chloride, NaOH, rt, 3 h; (ii)EtOH, CS2, KOH, 60 °C, 3 h; (iii) acetonitrile, thiol derivative, K2CO3, 70 °C, 3 h.
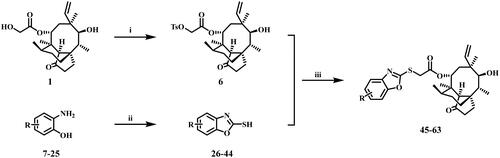
Table 1. MIC and MBC (μg/mL) values of compounds 45-63, tiamulin, valnemulin and vancomycin against MRSA ATCC 43300, MSSA ATCC 29213, S. aureus AD3 and S. aureus 144.
Figure 2. Time-kill curves for MRSA ATCC 43300 with different concentrations of compound 50 (a) and compound 57 (b).
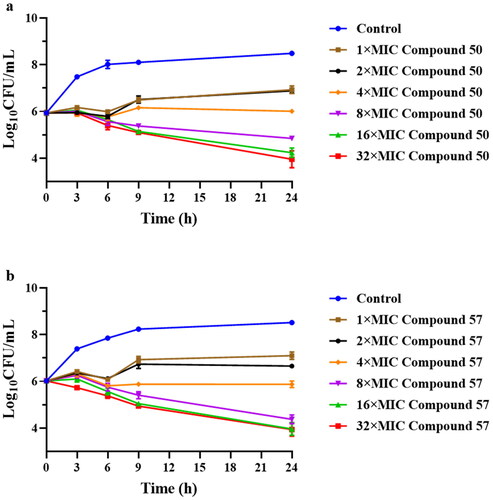
Figure 3. The bacterial growth kinetic curves for MRSA ATCC 43300 exposed to compound 50 (a) and compound 57 (c) for 2 h and compound 50 (b) and compound 57 (d) for 1 h.
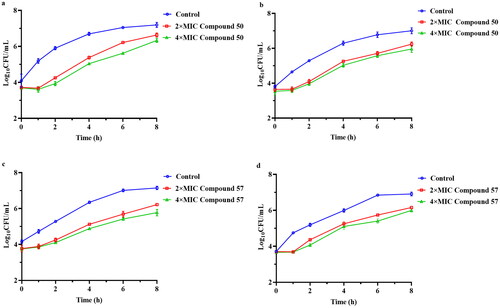
Table 2. The PAEs values of compounds 50 and 57 against MRSA ATCC 43300.
Figure 4. The cytotoxicity of tiamulin, valnemulin, and compounds 45–63 against RAW 264.7 cells.
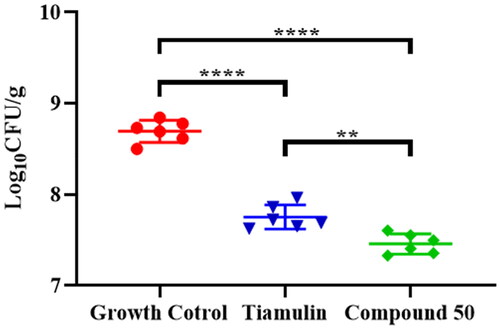
Figure 5. Efficacy of compounds against MRSA ATCC 43300 in murine neutropenic thigh models: red circular: growth control; blue triangle: tiamulin (20 mg/kg); green rhombus: compound 50 (20 mg/kg).
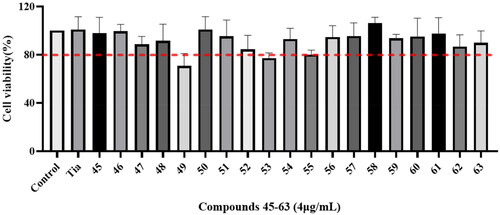
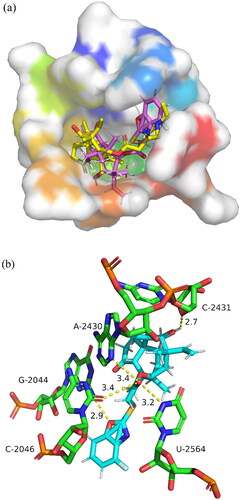
Figure 6. Description of docking poses of compound 50 to the residues of 1XBP.