Figures & data
Figure 1. Structure, domains, and catalytic dyad of the viral main protease Nsp5. Domain I (8–101 residues) is shown with blue ribbon; domain II (102–184 residues) is shown with purple ribbon; domain III (201–303 residues) is shown with magenta ribbon; the loop (185–200 residues) connecting domains II and III is shown with pink ribbon. The catalytic machinery is highlighted in the box.
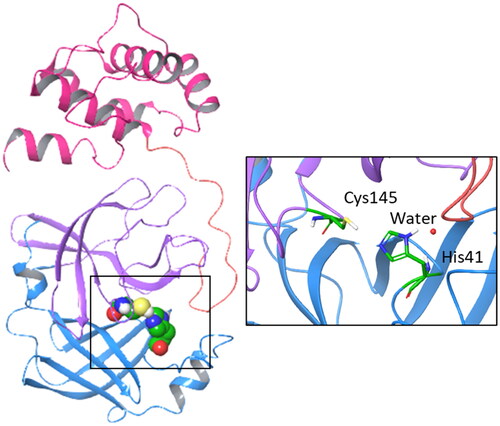
Figure 2. Chemical structures and mechanistic profile of Nirmatrelvir (1) and selected inhibitors (2–6) of the viral main protease Nsp5.
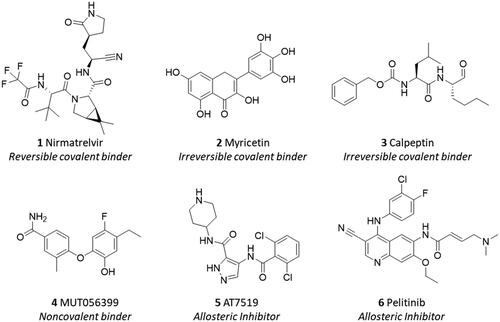
Figure 3. Chemical structures of ellagic acid (7) and urolithins A–C (8–11).
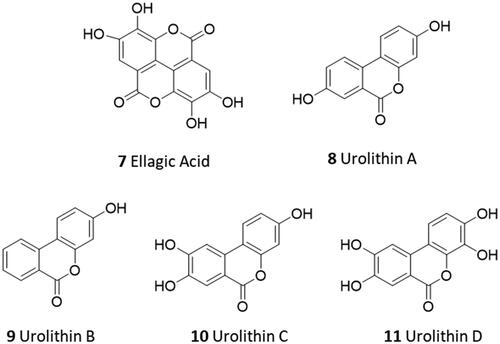
Figure 4. Predicted pKa values of ellagic acid (7), its possible acid-hydrolysed product (7-bis), and urolithins A–D (8–11); predicted pKa values of phenolic groups are blue-labelled if they were not experimentally determinable; predicted pKa values are red-labelled if they were successfully determined by the potentiometric method ().
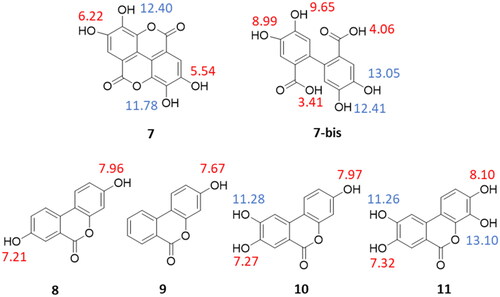
Table 1. Physicochemical properties of ellagic acid (7) and urolithins (8–11).
Figure 5. Boiled-egg representation of ellagic acid and urolithins A-C according to their TPSA and cLogP values, suggesting BBB permeability (BBB+, orange region), GI absorption (GI+, white region). Compounds predicted as P-gp substrate (P-gp+) are indicated with a blue circle; compounds predicted as negative P-gp substrate (P-gp−) are indicated with a red circle. The plot was generated using SwissADME.
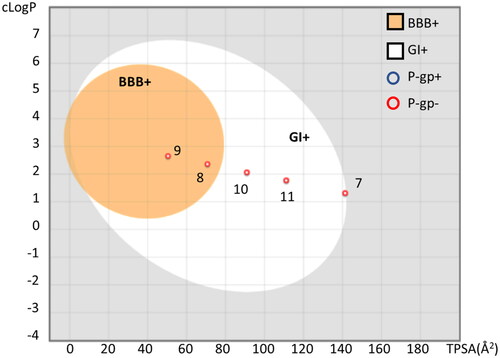
Table 2. Dissociation constants and Binding Efficiency Index (BEI) of nirmatrelvir (1), ellagic acid (7), and urolithins (8–11) to NT650-Nps5.
Figure 6. Binding curves of nirmatrelvir (1) to NT650-Nps5 in the absence (red points and line) and presence of 100 nM (light blue points and line) and 1000 nM (blue points and line) of urolithin D (11). Results are obtained from n0.3 independent measurements; bars represent the standard deviation of the points.
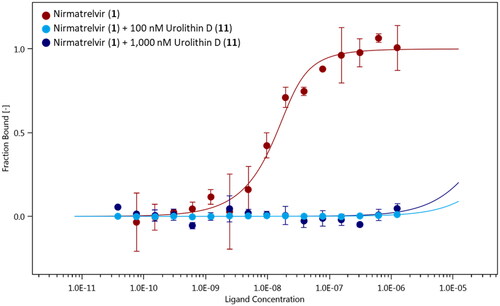
Figure 7. Overlap of the experimental binding mode (green carbon sticks; pdb code 7B3E) and predicted binding mode (orange carbon sticks; top scored solution) of myricetin (2) as resulting from the docking study (RMSD = 1.57 Å). The RMSD is calculated between the corresponding heavy atoms of the flavonoid moiety of 2. The covalent bond between the aromatic carbon atom in 2′ position of 2 and Cys145 is shown as blue dashed line.
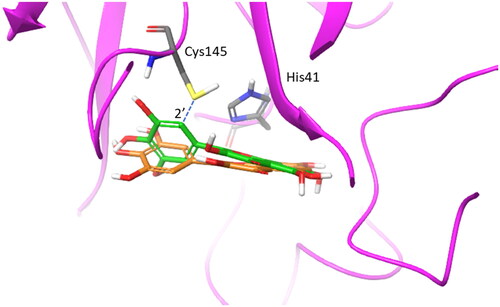
Table 3. Docking scores (GScore, kcal/mol) of myricetin (2), ellagic acid (7), and urolithins (8–11) into the catalytic site of Nps5.
Figure 8. Binding mode (orange carbon sticks; top-scored solution) of ellagic acid (7) as resulting from the docking study. Catalytic site residues involved in hydrogen bond and π-stacking interactions () with 7 are bold labelled. Hydrogen bonds are shown as yellow dashed lines.
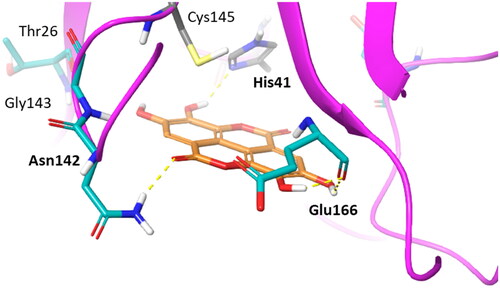
Figure 9. Binding modes (orange carbon sticks; top-scored solutions) of urolithins A–D (8, A; 9, B; 10, C; 11, D) as resulting from the docking study. Catalytic site residues involved in hydrogen bonds and π-stacking interactions with compounds 8–11 () are bold labelled. Hydrogen bonds are shown as yellow dashed lines.
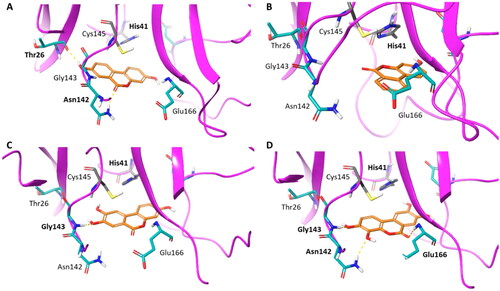
Figure 10. Cytotoxic effect of urolithin D (11) and nirmatrelvir (1) on Vero E6 cells. Cells were incubated with different concentrations of urolithin D (A) or nirmatrelvir (B) for 24 h and cellular viability was assessed through the MTT reduction assay. Data are expressed as mean ± SD of cell viability percentage with respect to control from two independent experiments performed in triplicate.
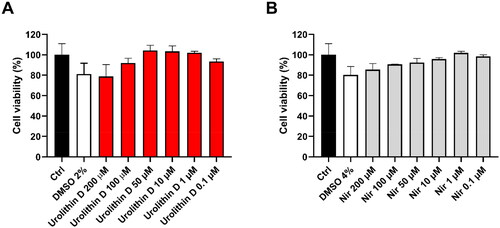
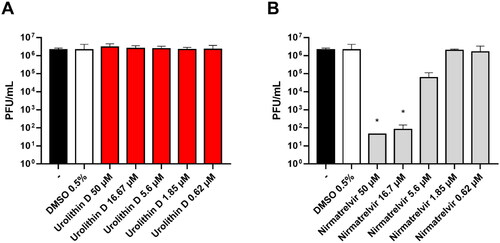
Figure 11. Antiviral activity of urolithin D (11) and nirmatrelvir (1). Cells were infected with 0.01 multiplicity of infection of SARS-CoV-2 BA.5 variant and treated with different concentrations of (A) urolithin D or (B) nirmatrelvir for 48 h. After incubation, the supernatant viral load was assessed through plaque assay. Viral titres are expressed as mean ± SD of plaque-forming units (PFU)/mL from two experiments performed in triplicate. *p < 0.05, antiviral-treated sample vs. vehicle-treated sample.