Figures & data
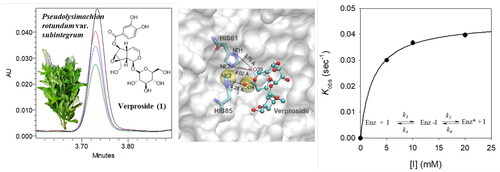
Figure 1. (A) UPLC-PDA and (B) UPLC-QTOF-MS data of the Pseudolysimachion rotundum var. subintegrum extract after the binding experiment. Black: not exposed to enzyme; red, blue, and green; after incubation with tyrosinase for 15 min. Peaks numbered 1 − 9 represent the compounds isolated from P. rotundum var. subintegrum in our study.
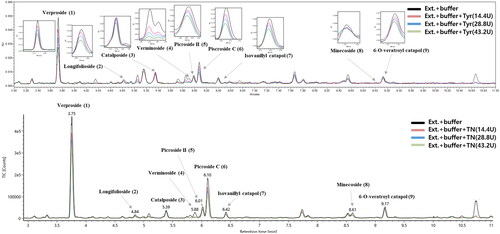
Table 1. UPLC chromatographic, UV–Vis, and mass spectral data of the compounds identified from P. rotundum var. subintegrum.
Figure 2. Chemical structures of the major compounds isolated from the extract of the whole plant of Pseudolysimachion rotundum var. subintegrum.
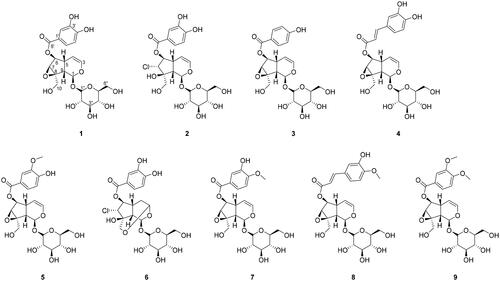
Figure 3. (A) Effects of compounds 1, 2, and 8 on the activity of tyrosinase to catalyse L-tyrosine. (B) Lineweaver-Burk plots to investigate the ability of compound 1 to inhibit the monophenolase activity of tyrosinase. (C) Dixon plots to investigate the ability of compound 1 to inhibit the monophenolase activity of tyrosinase. (D) Time-dependent chromatograms of tyrosinase in the presence of compound 1 using UPLC-PDA. (E) Inhibition as a function of preincubation time for the most active compound 1 (5, 10, and 20 mM). (F) Plot of kobs as a function of the concentration of the slow-binding inhibitor 1 fitted by EquationEquation (4)(4)
(4) .
![Figure 3. (A) Effects of compounds 1, 2, and 8 on the activity of tyrosinase to catalyse L-tyrosine. (B) Lineweaver-Burk plots to investigate the ability of compound 1 to inhibit the monophenolase activity of tyrosinase. (C) Dixon plots to investigate the ability of compound 1 to inhibit the monophenolase activity of tyrosinase. (D) Time-dependent chromatograms of tyrosinase in the presence of compound 1 using UPLC-PDA. (E) Inhibition as a function of preincubation time for the most active compound 1 (5, 10, and 20 mM). (F) Plot of kobs as a function of the concentration of the slow-binding inhibitor 1 fitted by EquationEquation (4)(4) kobs=k6+ [(k5 × [I])/(Kiapp + [I])](4) .](/cms/asset/9ed0c31a-4f38-405d-8803-fc6f66329bf9/ienz_a_2252198_f0003_c.jpg)
Table 2. Inhibitory effects of isolated iridoids 1 − 9 on tyrosinase activity.
Table 3. Docking simulation results of isolated iridoids 1 − 9 on tyrosinase activity.
Figure 4. Molecular docking views of two compounds, verproside and kojic acid, on two tyrosinases: (A) verproside-mTyr, (B) verproside-hTyr, (C) kojic acid-mTyr, and (D) kojic acid-hTyr. The tyrosinases are represented by a white surface protein model, and the two Copper ions present in the tyrosinases are represented by a yellow space-filling model. The active site is highlighted by a red transparent box. The compounds are represented by ball and stick models with atom colours: red for Oxygen, cyan for Carbon, and white for Hydrogen.
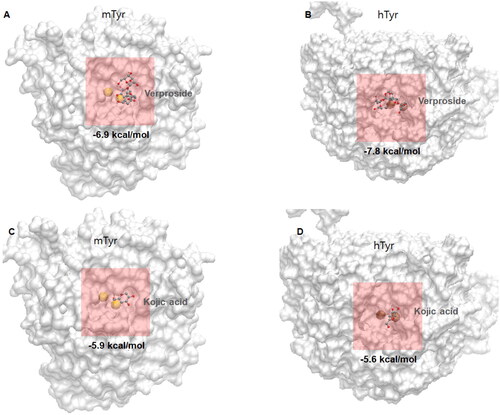
Figure 5. Hydrogen bonding patterns of two compounds, verproside and kojic acid, on two tyrosinases, mTyr and hTyr: (A) verproside-mTyr, (B) verproside-hTyr, (C) kojic acid-mTyr, and (D) kojic acid-hTyr. The active site, highlighted by the red transparent box in , is magnified to show the detailed hydrogen bonding pattern. The compounds are drawn using the ball and stick model and coloured by atom: red for Oxygen, cyan for Carbon, and white for Hydrogen. The hydrogen bonding interactions are indicated by dotted lines with the interaction numbers. The detailed hydrogen bonding patterns are provided in Supplementary material Table S2.
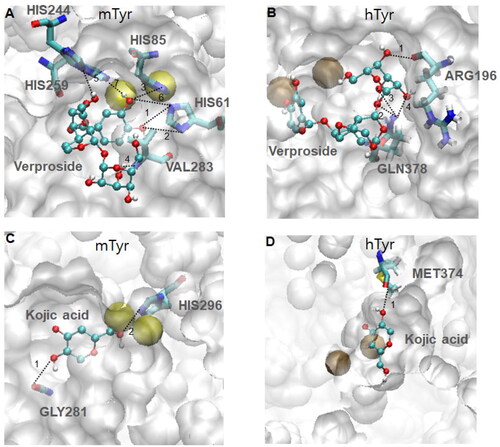
Table 4. Docking simulation comparisons of verproside and kojic acid on mushroom (mTyr) and human tyrosinase (hTyr).
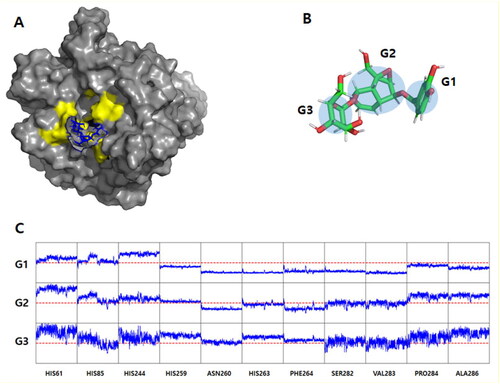
Figure 6. Molecular dynamics simulation results. (A) The final structures of mTyr-verproside complex. The tyrosinases are depicted using a grey surface model, while the active site revealed by docking simulation is coloured yellow. The verproside is represented by a blue stick model. For clarity, the explicit water models and counter ions are not included in the figure. (B) Verproside grouping. The centre of geometry (COG) of the atoms comprising the rings was utilised to measure the interacting distance. The measurement was conducted between the COG and the alpha Carbon atom of the interacting residues. (C) The interaction distance between verproside and mTyr. It consists of 33 sub-panels, each displaying the distance-time profile (X-axis: time from 0 to 100 ns; Y-axis: distance from 0 to 20 Å). The Y panel is divided into three groups, namely G1, G2, and G3, as mentioned in . The red dotted line represents the distance of 10 Å, which serves as the lower limit distance.