
Figures & data
Figure 1. Structure of SLC-0111 and molecular structures of 2-sulphanilamide-7-substituted [1,2,4]triazolo [1,5-a]pyrimidines 1a–ac reported in this article.
![Figure 1. Structure of SLC-0111 and molecular structures of 2-sulphanilamide-7-substituted [1,2,4]triazolo [1,5-a]pyrimidines 1a–ac reported in this article.](/cms/asset/d4c18182-2489-4f77-b9f9-790d56f6a06d/ienz_a_2270180_f0001_c.jpg)
Scheme 1. Reagents. (a) THF, sulphanilamide, reflux, 18 h; (b) NH2NH2·H2O, THF, rx, 18 h; (c) DMF-DMA, DMF, reflux, 4 h; (d) AcOH, 80 °C, 4 h.
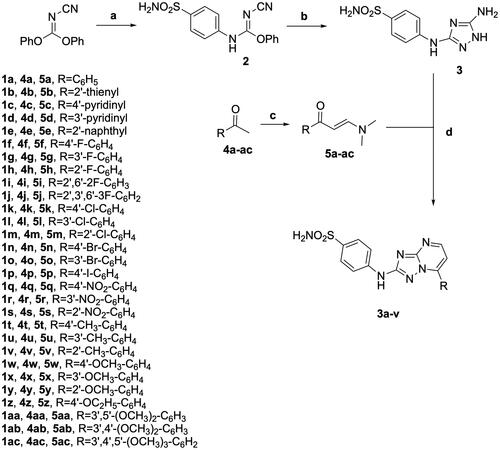
Table 1. Inhibition data of human CA isoforms I, II, IV, IX, and XII with novel synthesised triazolopyrimidine derivatives 1a–ac using acetazolamide (AAZ) and SLC-0111 as standard inhibitors.
Table 2. Selectivity indexes (SIs) for the inhibition of transmembrane human CA isoforms hCA IX and XII over off-targets isoforms hCA I, IV, and II for target 2-sulfanilamido triazolopyrimidines 1a–ac, acetazolamide (AAZ) and SLC-0111.
Figure 2. Binding mode of compound 1a in the active site of CA isoforms I (A). Binding modes of compound 1j in the active site of CA isoforms II (B), IV(C), and XII (E). Binding mode of compound 1v in the active site of CA isoforms IX (D).
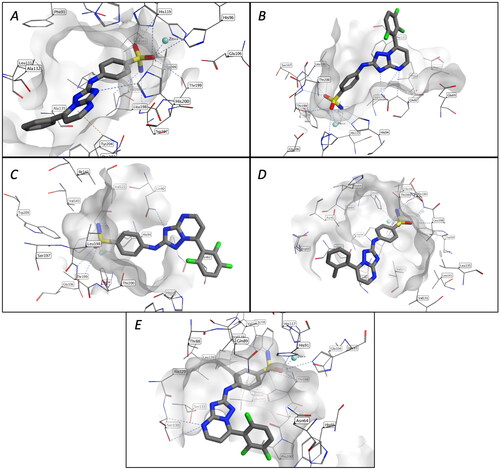
Figure 3. Binding modes of 1x (A), 1y (B), and 1w (C) in the active site of CA isoforms IX, and the superposition of the binding poses of the three analogues 1w–y (D).
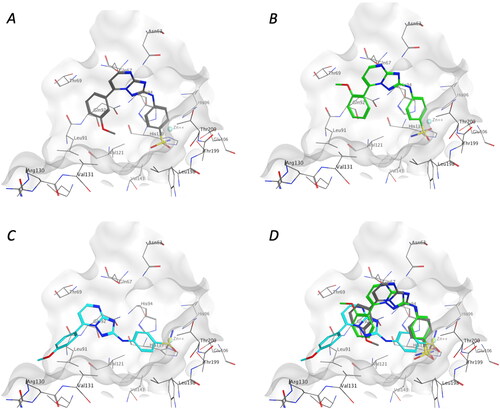
Table 3. Cytotoxicity of selected compound in PBL.
Figure 4. Antiproliferative activity of the indicated compounds in medulloblastoma cell lines (DAOY, upper panels; HDMB lower panels). Cells were treated with the compounds at the concentration of 10 µM alone or in combination with cis-Pt (1.8 µM) for 72 h. SLC-0111 was used as reference compounds at the concentration of 10 µM. Data are expressed as mean ± SE of three independent experiments. *p < 0.05; **p < 0.01; ***p < 0.001; ****p < 0.0001.
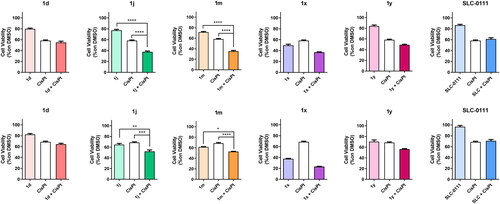
Figure 5. Antiproliferative activity of the indicated compounds in glioblastoma primary cell lines (HuTuP192, upper panels; HuTuP108 lower panels). Cells were treated with the compounds at the concentration of 10 µM alone or in combination with TMZ (500 µM) for 72 h. SLC-0111 was used as reference compounds at the concentration of 10 µM. Data are expressed as mean ± SE of three independent experiments. *p < 0.05; ****p < 0.0001.
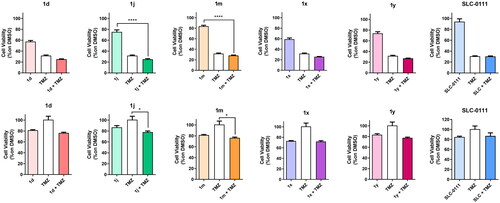
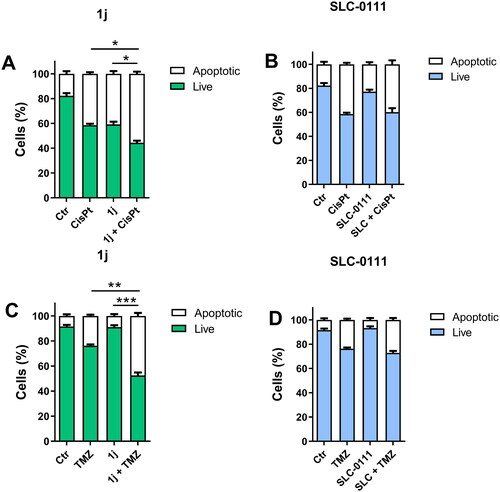
Figure 6. Induction of apoptosis in medulloblastoma (HDMB, panels A and C) and GBM cells (HuTu-108, panels B and D) by 1j and SLC-0111 as reference compounds. Cells were treated with 1j (10 µM) or SLC-0111 (10 µM) both alone or in combination with cis-Pt (1.8 µM) or TMZ (500 µM) for 72 h. The cells were then labelled with Annexin-V and PI as described in “Materials and methods” section and analysed by flow cytometry. Data are expressed as mean ± SE of three independent experiments. *p < 0.05; **p < 0.01; ***p < 0.001.
Supplemental Material
Download PDF (6 MB)Data availability statement
1H NMR, 13C NMR, ESI-mass, and UV–vis spectra of compounds 1a–ac. Preparation and purification CA isoforms. Supplementary data associated with this article can be found in the online version.