
Figures & data
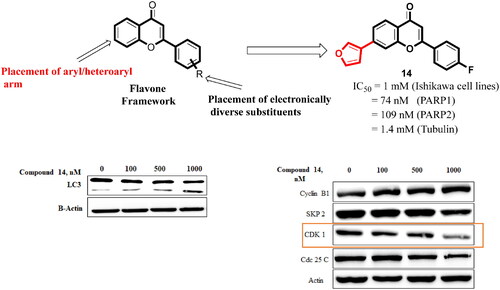
Figure 1. Reported flavonoid-based PARP inhibitors.
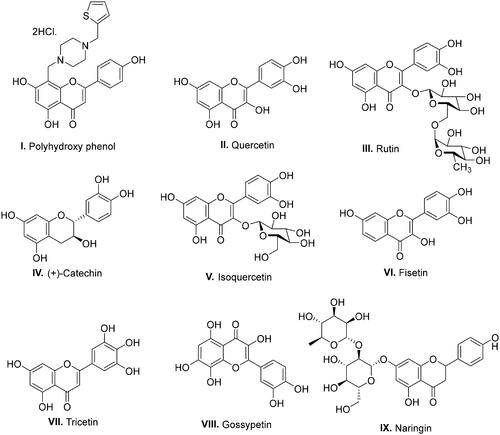
Figure 2. Validation of the docking protocol. The docking protocol was validated via redocking the co-crystallized ligands. The re-docked ligands (yellow) produced a pose similar to those of the co-crystallized ligands (red) (A- PARP1; B- PARP2 and C- Tubulin).
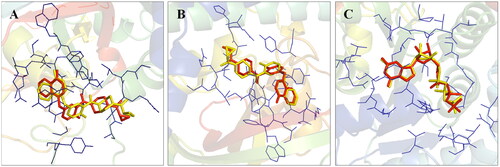
Table 1. Docking score and residues involved in binding interactions of compound 1 with PARP1, PARP2, and tubulin.
Figure 3. Interaction analysis of 1 with PARP1. (A) Overlay of 1 (yellow) with co-crystallized ligand (red). (B) Orientation of 1 in the active site. (C) 3D docked pose of 1. (D) 2D docked pose of 1 showing hydrophobic interactions with PARP1.
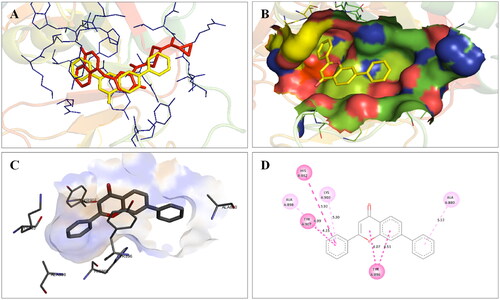
Figure 4. Interaction analysis of 1 with PARP2. (A) Overlay of 1 (yellow) with co-crystallized ligand (pink). (B) Orientation of 1 in the active site of PARP2 protein. (C) 3D docked pose of 1. (D) 2D docked pose of 1 showing hydrophobic interactions.
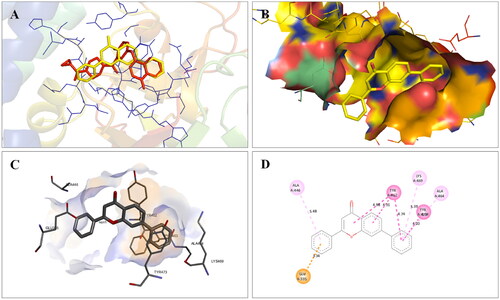
Figure 5. Interaction analysis of 1 with tubulin. (A) Overlay of 1 (yellow) with co-crystallized ligand (pink). (B) Orientation of 1 in the active site of tubulin. (C) 3D docked pose of 1. (D) 2D docked pose of 1 showing hydrophobic interactions with tubulin.
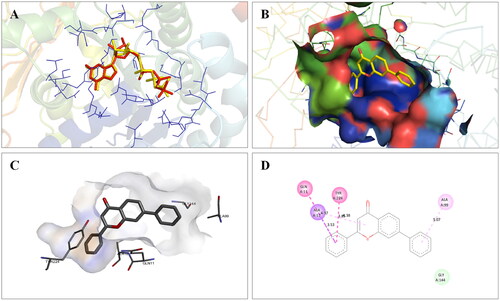
Figure 6. Design strategy.
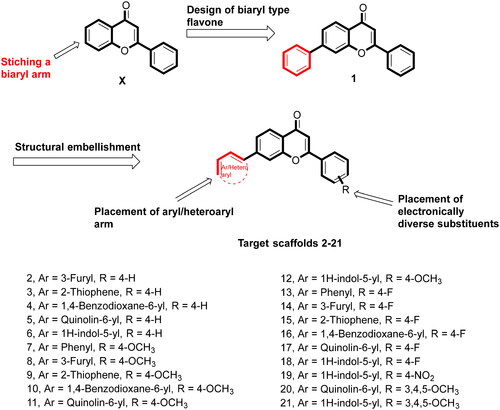
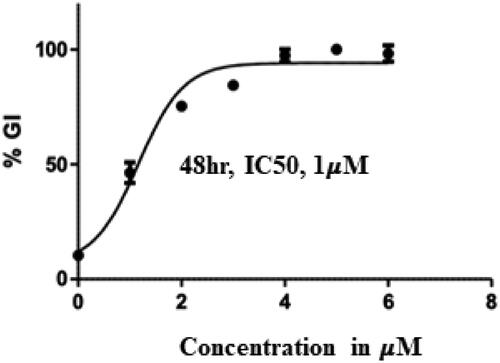
Figure 7. IC50 value of compound 14 (Treatment concentrations- 2,4,6 and 8 µM).
Scheme 1. Reagents and conditions: (A) NaOH, Ethanol, rt, 24h; (B) I2, DMSO, reflux, 24 Wh; (C) aryl/heteroaryl boronic acids, Pd(PPh3), Dioxane: Water (9:3), reflux, 100 °C, 2h.
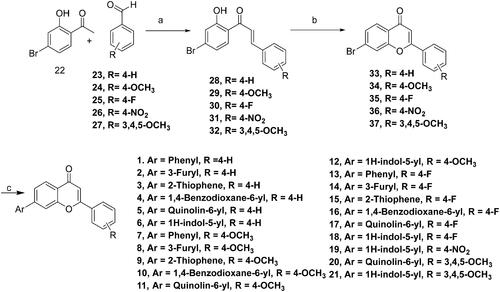
Table 2. In-vitro growth inhibition (IC50 in µM) effects of the compounds (1–21).
Figure 8. IC50 values (PARP inhibition) of compound 14, Olaparib and Veliparib.
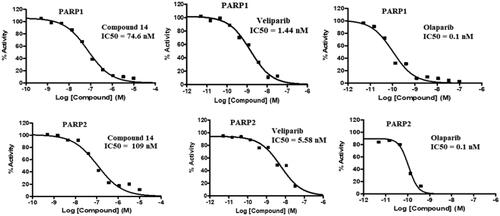
Table 3. PARP1 and PARP2 inhibitory activity of compound 14.
Table 4. Tubulin inhibitory activity of compound 14 (Treatment concentrations – 0.1, 1, 5, 10 μM).
Figure 9. Effect of compound 14 on the cell wall and nuclear morphology of Ishikawa cells.
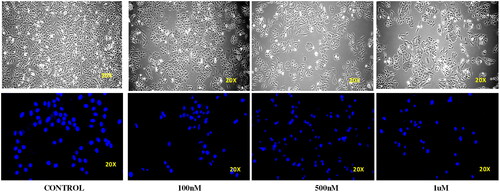
Figure 10. Morphology of untreated Ishikawa cells (control) and those treated with 0.1, 0.5, and 1 µM of compound 14.
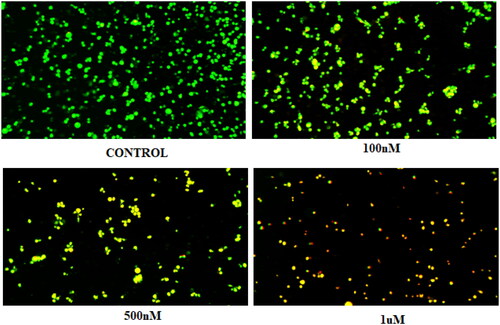
Figure 11. (A) Cleavage of LC-3 (autophagy marker) (B) Protein expression was measured by western blotting after 24 h treatment. The intensity of the band indicates down regulation of proteins in the cells. Data represented as the mean of three independent experiments. Statistical significance is represented as follows: ns - non-significant, * p < 0.05, *** p < 0.001.
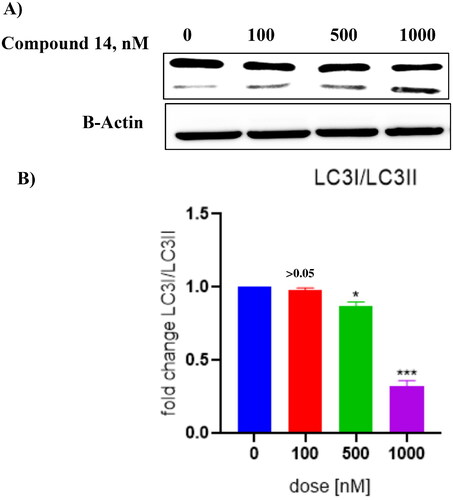
Figure 12. Results of Rhodamine staining assay.
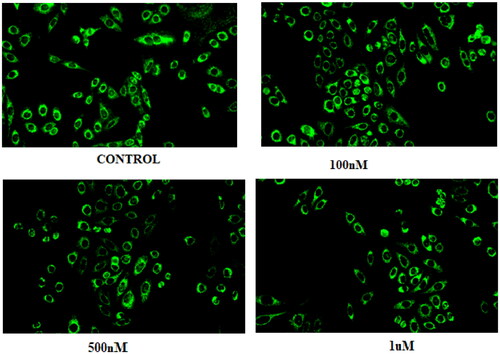
Figure 13. Results of DCFDA staining.
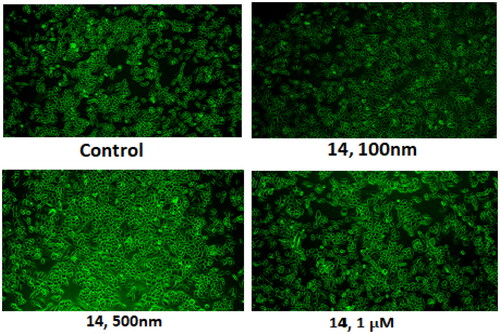
Figure 14. Effect of compound 14 on cell cycle proteins regulating G2/M progression at indicated concentrations. Statistical significance is represented as follows: ns - non-significant, *p < 0.05, ** p < 0.01.
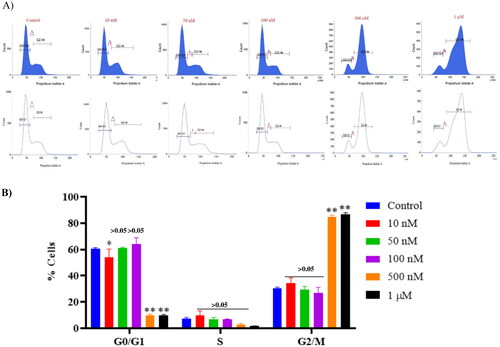
Figure 15. (A) Expression levels of proteins (B) Protein expression was measured by western blotting after 24 h treatment. The intensity of the band indicates the down-regulation of proteins in the cells. Data represented as the mean of three independent experiments. Statistical significance is represented as follows: ns - non-significant, *p < 0.05, ** p < 0.01, *** p < 0.001.
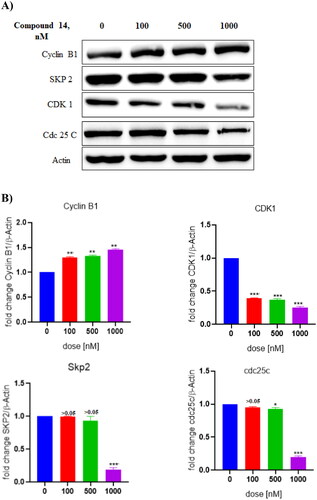
Figure 16. Interaction analysis of 14 with PARP1. (A) Overlay of 14 (yellow) with co-crystallized ligand (red). (B) Orientation of 14 in the active site of PARP1 protein. (C) 3D docked pose of 14 showing hydrogen bond interaction. (D) 2D docked pose of 14 showing hydrogen bond and hydrophobic interactions in the active site of PARP1 protein.
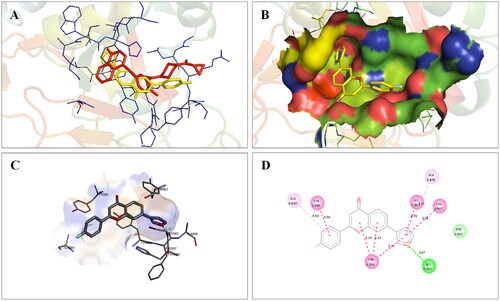
Figure 17. Interaction analysis of 14 with PARP2. (A) Overlay of 14 (yellow) with co-crystallized ligand (pink). (B) Orientation of 14 in the active site PARP2 protein. (C) 3D docked pose of 14 showing hydrogen bond interaction. (D) 2D docked pose of 14 showing hydrogen bond and hydrophobic interactions in the active site of PARP2 protein.
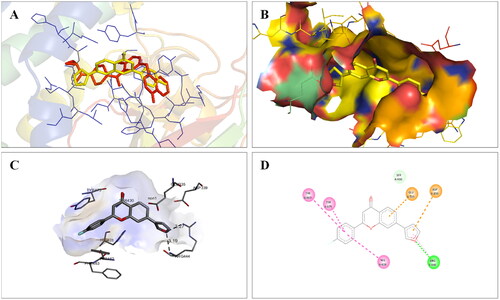
Figure 18. Interaction analysis of 14 with tubulin. (A) Overlay of 14 (yellow) with co-crystallized ligand (pink). (B) Orientation of 14 in the active site of tubulin protein. (C) 3D docked pose of 14 showing hydrogen bond interactions. (D) 2D docked pose of 14 showing hydrogen bond and hydrophobic interactions in the active site of tubulin protein.
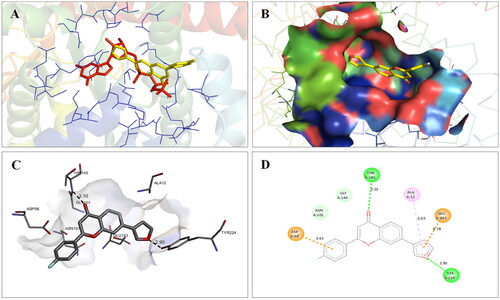
Table 5. Docking score and residues involved in binding interactions of compound 14 with PARP1, PARP2 and tubulin.
Figure 19. Docked pose showing binding interactions of olaparib with PARP1.
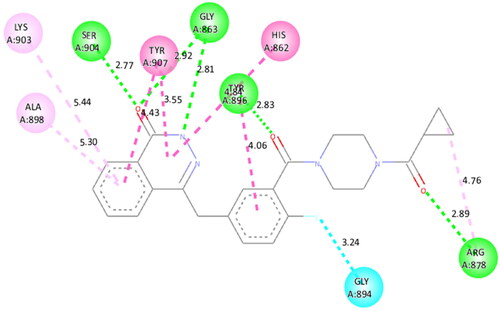
Figure 20. Docked pose showing binding interactions of olaparib with PARP2.
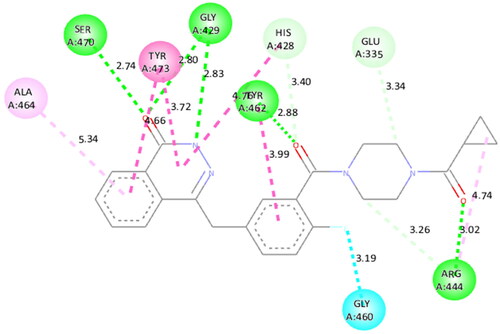
Figure 21. Docked pose showing binding interactions of combretastatin A4 with tubulin.
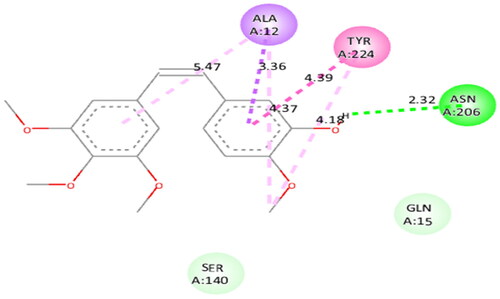
Table 6. ADME parameters of compound 14 predicted using the SwissADME online tool.