
Figures & data
Figure 1. Structures of approved agents for the treatment of influenza viral infection.
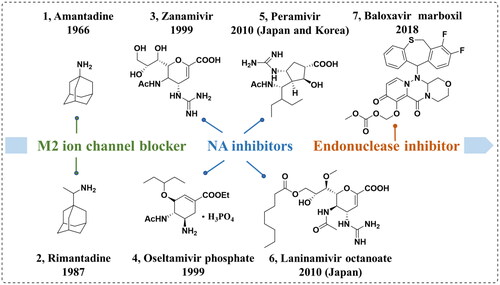
Figure 2. Comparison of the crystal structures of representative group-1 Nas (N1, PDB code: 2HU0, N8, PDB code 2HT7), group-2 Nas (N2, PDB code 4GZP), and 09N1 (PDB code 3TI6).
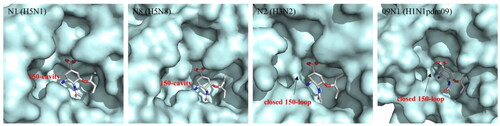
Figure 3. Structures of our previously reported group-1-specific influenza NA inhibitors (JMC23d and JMC21h) and non-specific group-1 and group-2 NA inhibitors (JMC15b and JMC15c).
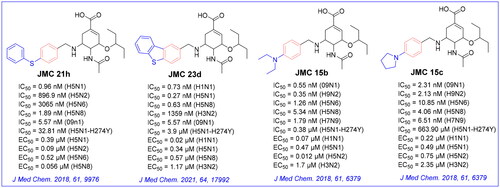
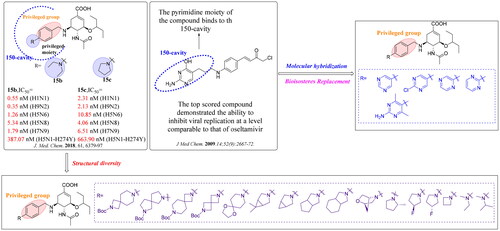
Figure 4. The novel designed oseltamivir analogues via targeting the 150-cavity.
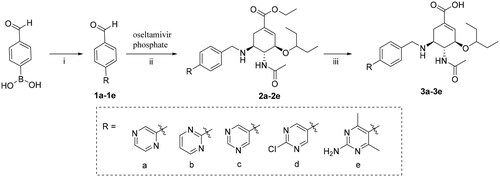
Scheme 1. Reagents and conditions: (i) Corresponding bromo-substituted aromatic heterocycle, K3PO4, Pd(PPh3)4, N2, toluene/H2O = 25/2, 100 °C, 12 h; (ii) NaBH3CN, CH3OH, r.t., 6–7 h; (iii) 1 M NaOH, CH3OH, r.t., then 3 M HCl.
Scheme 2. Reagents and conditions: (i) Corresponding amine, K2CO3, DMF, 100 °C, 12 h; (ii) NaBH3CN, CH3OH, r.t., 6–7 h; (iii) 1 M NaOH, CH3OH, r.t., then 3 M HCl.
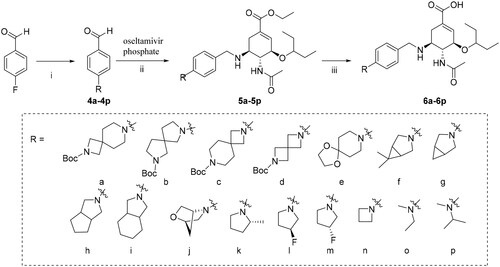
Table 1. Neuraminidase (NA) inhibition of oseltamivir derivatives in chemiluminescence-based assay. 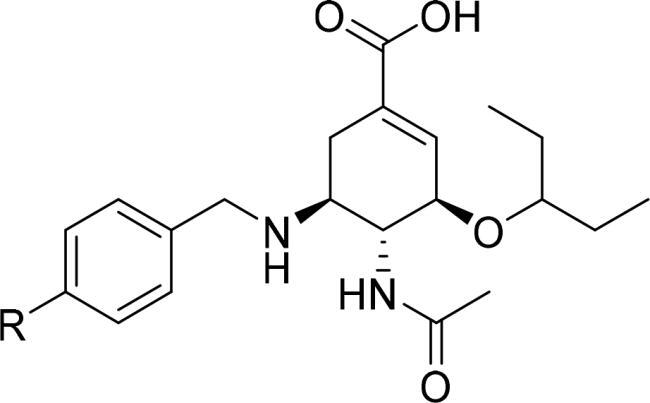 .
.
Table 2. Anti-influenza virus activity and cytotoxicity of selected compounds in CEFs.
Table 3. Anti-influenza virus activity and cytotoxicity of selected compounds in MDCK cells.
Figure 5. Docking of compound 6k in the binding site on NA of N1 (PDB ID: 3BEQ), N1 (PDB ID: 2HU0) and N2 (PDB ID: 4K1K). (A, B, C) Superposition of 6k and OSC with N1 NA and N2 NA, respectively; (D, E, F) The key interactions formed by OSC with N1 and N2 NA, respectively; (G, H, I) The key interactions formed by 6k with N1 and N2 NA, respectively. Hydrogen bonds are shown as dashed lines (yellow).
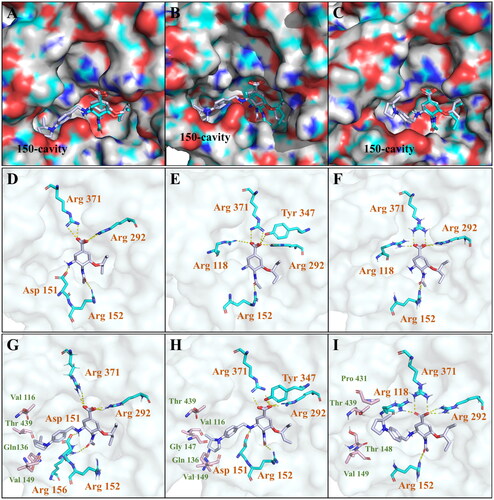
Figure 6. The result plots of molecular dynamics simulations. (A) The protein backbone RMSD plot of the NA with 6k binding throughout the MD trajectory of 200 ns; (B) The ligand heavy atom RMSD plot when bound to the NA; (C) RMSF plot of the protein chain in 6k bound state.
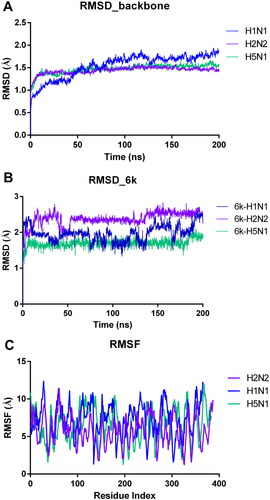
Figure 7. The neuraminidase inhibitory activity assay of 6k and OSC with different incubation time with NA. (A) The dose–response–inhibition curve of 6k at different incubation time; (B) The dose-response–inhibition curve of OSC at different incubation time.
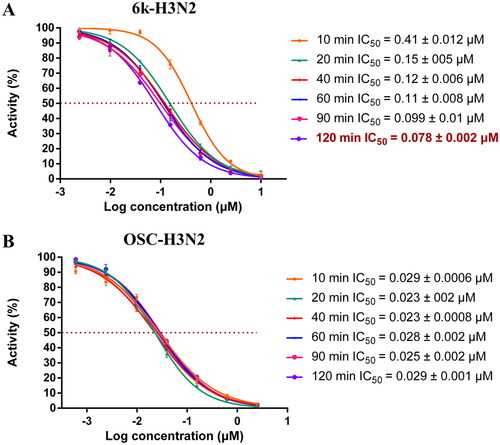
Table 4. Physicochemical properties of some representative compounds.