
Figures & data
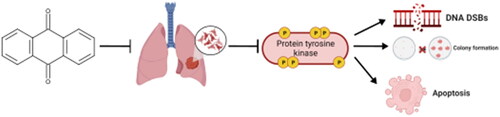
Table 1. Chemical structures of 9,10-dioxoanthracenyldithiocarbamates. 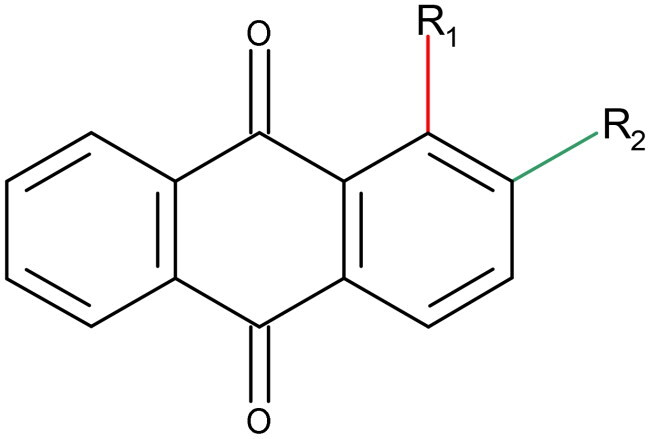
Table 2. The in vitro growth inhibitory activity of anthraquinones was assessed by determining their IC50 values (± SD, µM), representing the compound concentration required to inhibit 50% of cell growth. The values reported are the means of three independent experiments, with etoposide and cisplatin used as references.
Figure 1. The ability of NSCLC cells to form colonies is impeded by anthraquinones. A visual representation of the colony formation assay is displayed on the left, and the quantitative results are presented on the right. The data shown in the panels represent the mean ± SEM of three independent experiments. ***p < 0.0001 and ****p < 0.00001 (two-way ANOVA and post hoc Dunnett’s test).
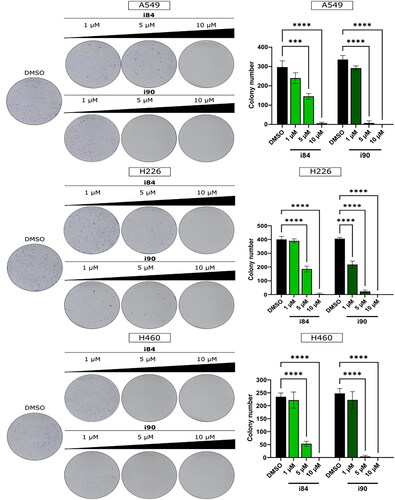
Figure 2. Analysis of BrdU incorporation after treatment of A549 cells with anthraquinones. DNA staining results are depicted in representative histograms with associated statistical evaluations. Graph bars present the quantification data, with error bars indicating the mean ± SD from three independent experiments (two-way ANOVA test).
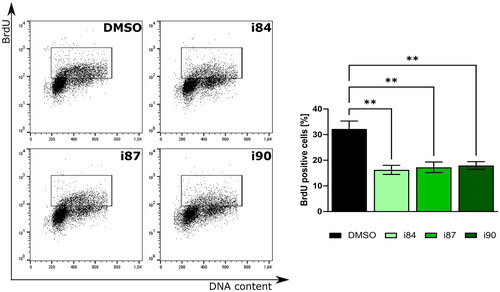
Figure 3. Anthraquinones induce DNA DSBs. (a) Representative high-resolution laser scanning confocal images showing the γ-H2AX after treatment A549 cell lines. For negative and positive controls, DMSO and etoposide (ETP) were utilised, respectively. Nuclei were counterstained with DAPI. Scale bars = 10 μm. (b) Representative histograms showing induction γ-H2AX in the A549 cell line at 24 h of treatment. (c) The quantification of the analysis is presented on a bar graph. **p < 0.001, ****p < 0.00001 (two-way ANOVA and post hoc Dunnett’s test).
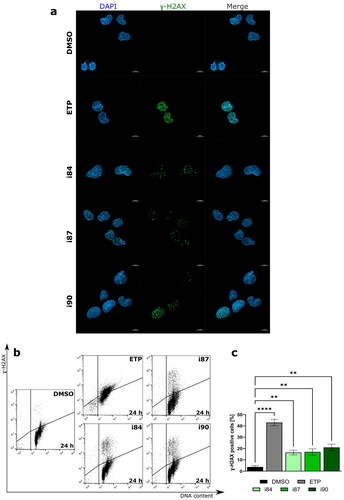
Figure 4. Flow cytometric analysis of A549 cell line after 24 h of treatment with anthraquinone compounds, using Annexin V-FITC/7-AAD. For negative and positive controls, DMSO and etoposide (ETP) were utilised, respectively. (a) Representative dot plots. (b) The quantitation of data is presented on a bar graph. **p < 0.001, ***p < 0.0001, and ****p < 0.00001 (two-way ANOVA and post hoc Dunnett’s test).
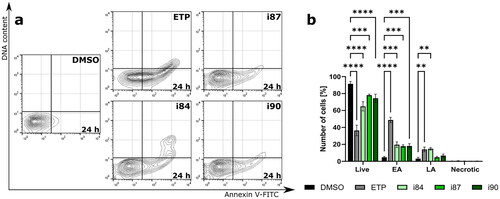
Figure 5. Analysis of changes in phosphorylation of protein tyrosine kinases after compounds treatment. DMSO and imatinib were used as negative and positive controls, respectively. (a) In vitro determination of PTK activity using A549 extracts determined by ELISA. (b) Representative histograms of compounds-treated A549 cells after intracellular hosphor-flow cytometry. (c) Representative microscopy images presenting immunofluorescence of microtubule and p-Tyr foci in A549 cells at 4 h of treatment. The microtubules are depicted in red, p-Tyr in green, and the nucleus is stained with DAPI (blue). Scale bars = 10 μm. (d) Quantification of intracellular hosphor-flow cytometry. *p < 0.01, **p < 0.001, ***p < 0.0001, ****p < 0.00001 vs. vehicle (one-way ANOVA and post hoc Dunnett’s test).
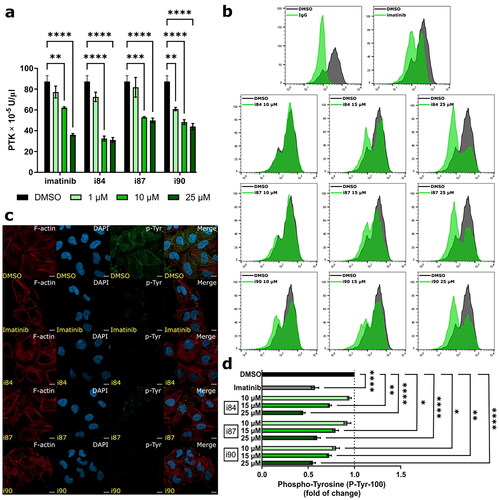
Figure 6. Analysis of changes in phosphorylation of protein tyrosine kinases after compounds treatment. (a) Human PTK overview. Green and red points refer to non-receptor and receptor PTKs, respectively. (b) Proteome profiler analysis of A549 cells after treatment with compounds. DMSO and imatinib were used as negative and positive controls, respectively. (c) Template presenting the location of tyrosine kinase antibody. (d) Profiling changes in PTKs after treatment with anthraquinones or imatinib with respect to the vehicle. Non-receptor and receptor PTKs are presented on the left and right panels, respectively.
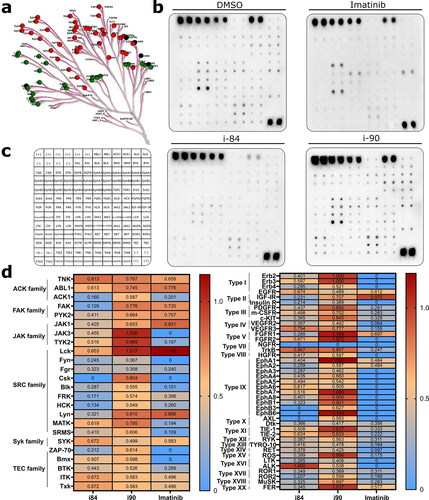
Table 3. Ligand–protein energies calculated with the Autodock Vina program.
Data availability statement
The datasets presented in the current study are available from the corresponding author upon reasonable request.