Figures & data
Figure 1. Representative structures of reported c-Met inhibitors.
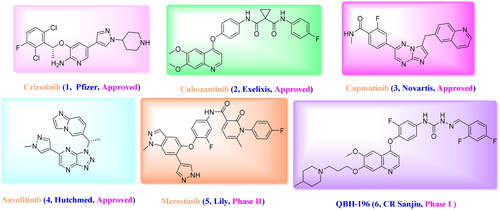
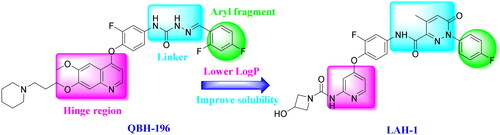
Figure 2. The design strategy of LAH-1 based on QBH-196.
Scheme 1. Reagents and conditions: (i) a) NaNO2, 15% HCl, H2O, 0 °C, 30 min; b) Ethyl acetylacetate, C2H5COONa, EtOH/H2O, 0–25 °C, 2 h; (ii) Ph3P = CHCOOC2H5, PhMe, 110 °C, 12 h; (iii) 10% NaOH, EtOH/THF, 50 °C, 4 h; (iv) 2-fluoro-4-nitrophenol, Pyridine, PhCl, 135 °C, 72 h; (v) Phenyl chloroformate, Pyridine, CH2Cl2, 0 °C, 30 min; (vi) 3-((tert-butyldiphenylsilyl)oxy)azetidine Et3N, THF, 70 °C, 4 h; (vii) Pd/C, H2, EtOH, r.t, 5 h; (viii) 10, HATU, DIPEA, DMF, r.t, 12 h; (ix) TBAF, THF, 0 °C to r.t, 30 min.
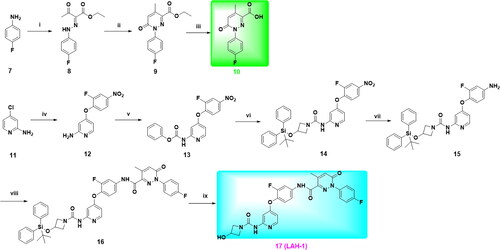
Figure 3. (A). The chemical structure of LAH-1; (B). The IC50 determination of LAH-1 against c-Met enzyme in vitro. (C). Kinase profile of LAH-1 against a panel of 18 kinases at 300 nM.
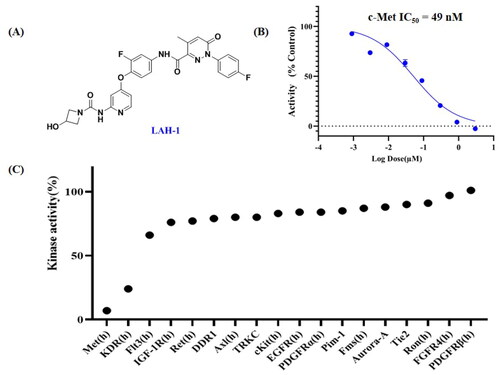
Figure 4. IC50 determination of LAH-1 against 5 c-Met addicted cancer cell lines and 1 non-addicted cell line. IC50 values were determined after exposure of cells to derivatives for 72 h, and data are expressed as the mean ± SD of two independent experiments.
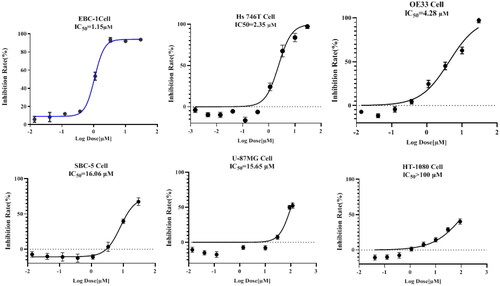
Figure 5. Western blot analyses of EBC-1 cells. Cells were treated with LAH-1 at the indicated concentrations for 2 h, and GADPH was used as a loading control. Each experiment was done in double, and representative images are shown, *p < 0.05, **p < 0.01, ***p < 0.001, ****p < 0.0001 as compared with control.
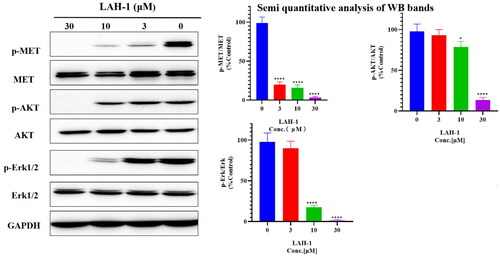
Figure 6. Quantification of apoptotic EBC-1 cells by Annexin V-FITC/PI dual staining, the data shown are the mean ± SD from two independent experiments. Q1: Early apoptotic cells, Q2: Late apoptotic cells. Q3: Necrotic cells, Q4: Living cells. *p < 0.05, **p < 0.01 as compared with control.
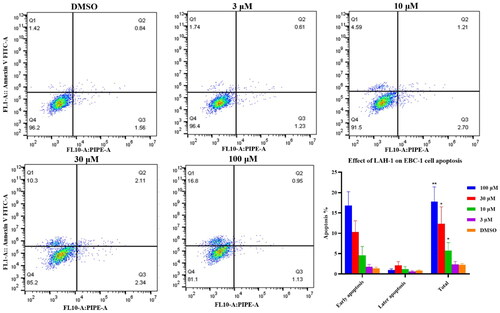
Figure 7. (A). EBC-1 cells were treated with different concentration of LAH-1. Cell plates were stained with crystal violet and imaged. Two independent experiments were carried out, and a representative plate is shown. (B). LAH-1 suppressed HGF-induced NCI-H441 cell invasion and migration. Representative images are shown. The relative migration (C) and invasion (D) fold change were plotted. The data shown are the mean from two independent experiments. *p < 0.05, **p < 0.01, ***p < 0.001, ****p < 0.0001 as compared with control.
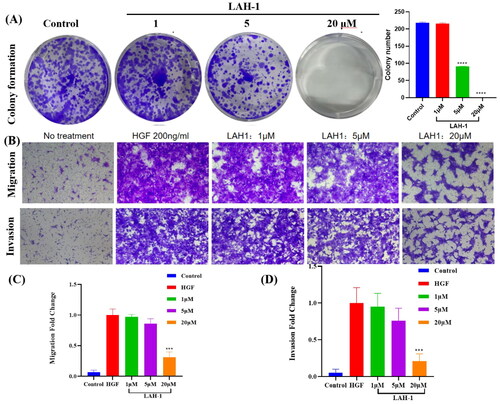
Table 1. In Vitro ADME and in vivo PK parameters for LAH-1.
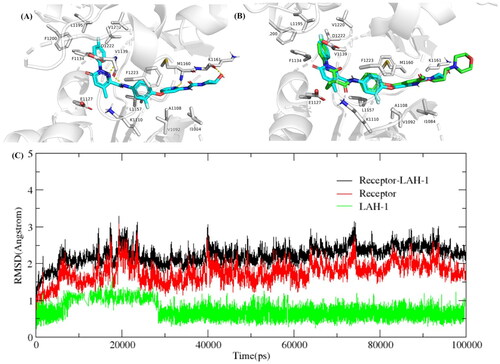
Figure 8. (A) Predicted binding mode of LAH-1 to c-Met (3LQ8). Hydrogen bonds are indicated by yellow dashed lines. Images are generated using PyMol. (B) The overlay of compound LAH-1 with Foretinib in c-Met. (C) Dynamics of LAH-1 bound to c-Met (3LQ8) during 100 ns simulation time.