
Figures & data
Figure 1. Examples of commercially available urea drugs 1–5.
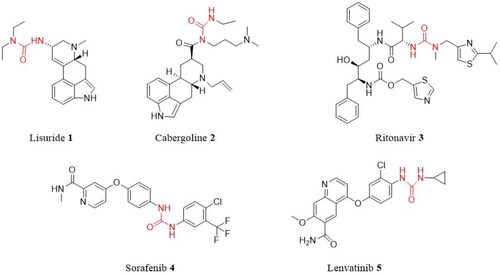
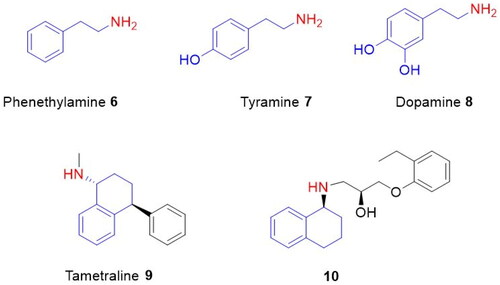
Figure 2. Phenethylamine 6, tyramine 7, dopamine 8, tametraline 9, and 1-aminotetralin derivative 10.
Scheme 1. Synthesis of substituted tetrahydronaphthalen-1-yl-phenethyl ureas 14–18.
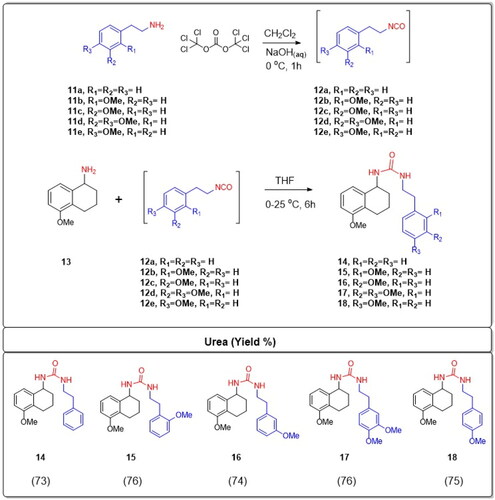
Table 1. Antibacterial activity of the synthesised ureas 14–18.
Table 2. Cytotoxic activity (IC50, μM) of the synthesised ureas (n = 4).
Figure 3. SH-SY5Y cells were exposed to produced ureas (12.5–500 M) for 48 h, and cytotoxicity was assessed using the WST-8 assay. GraphPad Prism 7.00 (GraphPad Software, La Jolla, CA) was used for statistical analysis, and ANOVA: Dunnett’s multiple comparison test calculated the results. *p < 0.01 when compared to the control group.
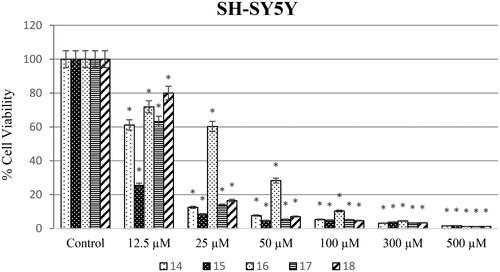
Figure 4. HeLa cells were exposed to produced ureas (12.5–500 M) for 48 h, and cytotoxicity was assessed using the WST-8 assay. GraphPad Prism 7.00 (GraphPad Software, La Jolla, CA) was used for statistical analysis, and ANOVA: Dunnett’s multiple comparison test calculated the results. *p < 0.01 when compared to the control group.
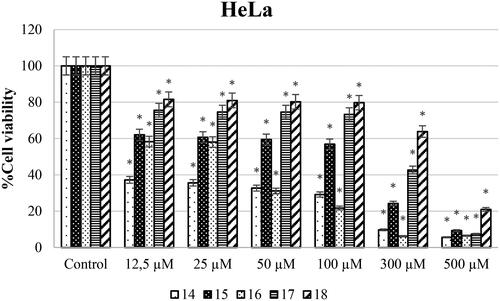
Figure 5. Percentage of cytotoxicity evaluated using the WST-8 test on PCS-201-012 cells after 48 h of exposure to produced ureas 14–18 (12.5–500 M). GraphPad Prism 7.00 (GraphPad Software, La Jolla, CA) was used for statistical analysis, and ANOVA: Dunnett’s multiple comparison test calculated the results. *p < 0.01 when compared to the control group.
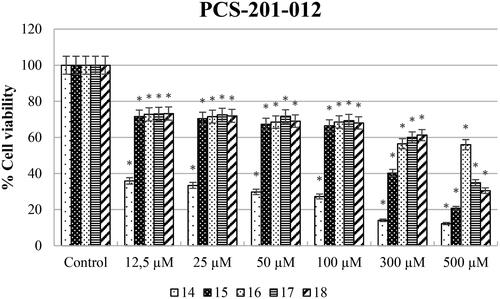
Table 3. SI values of the synthesised molecules (n = 4).
Data availability statement
The data presented in this study are available on request from the corresponding author. The data are not publicly available due to privacy.