Figures & data
Figure 1. The representative MDM2/MDMX dual inhibitors.
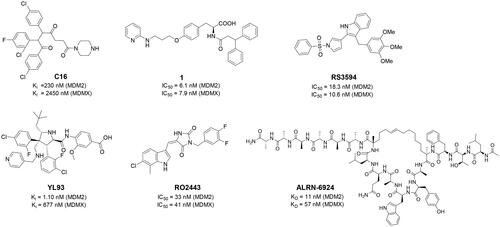
Figure 2. The binding modes of RO2443 with MDM2 and MDMX. One protein monomer is shown as a light-pink surface, and the other as an aquamarine cartoon. (A) The co-crystal structure of RO2443 with MDM2 (PDB: 3VBG); (B) The co-crystal structure of RO2443 with MDMX (PDB: 3U15).
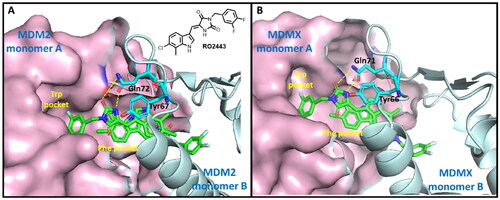
Figure 3. Virtual screening workflow for the identification of MDM2/MDMX dual inhibitors.
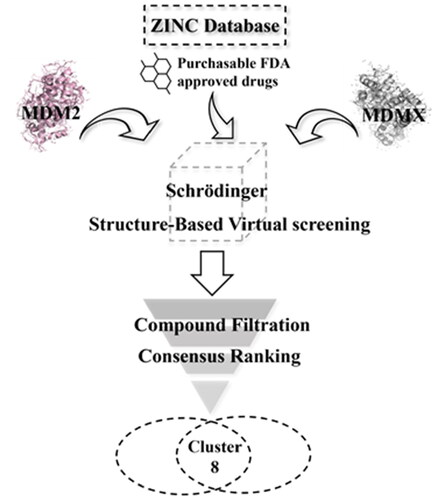
Table 1. Docking scores of selected drugs against MDM2 and MDMX.
Figure 4. Molecular docking analysis of nintedanib with MDM2 and MDMX. For explicitly, another molecule of nintedanib was removed. In A and B, the pink ribbon represents one MDM2 or MDMX monomer, and the gray ribbon represents another. (A) The superimposition of nintedanib (cyan) and RO2443 (magenta) in MDM2 dimer. The docking mode of nintedanib with MDM2 (PDB ID: 3VBG) is represented as a ribbon with the critical amino acid side chain explicitly shown (right). (B) The superimposition of nintedanib (cyan) and RO-443 (magenta) in MDMX dimer. The docking mode of nintedanib with MDMX (PDB ID: 3U15) is represented as a ribbon with the critical amino acid side chain explicitly shown (right). The yellow dotted line represents the hydrogen bonds in (A) and (B).
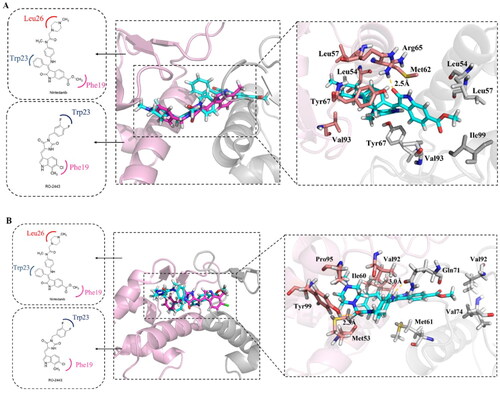
Figure 5. MD simulation analysis by GROMACS. (A) The protein backbone RMSD of proteins in complex with different ligands. (B) The protein backbone RMSD of proteins. (C) The protein backbone RMSD of ligands. (D) The binding mode of MDM2 with nintedanib (purple). For explicitly, one molecule of nintedanib was presented. The two chains of MDM2 were shown as yellow and cyan ribbon, respectively.
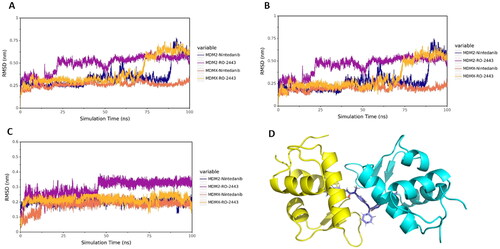
Table 2. Binding free energies and energy components predicted by MM/GBSA (kcal/mol).
Figure 6. The binding affinities of nintedanib to MDM2 and MDMX. (A) The fitting curve of nintedanib to MDMX (1–110) in MST assay. (B) The fitting curve of nintedanib to MDM2 (1–110) in MST assay.
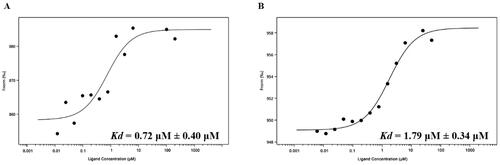
Figure 7. Antiproliferation of nintedanib against tumour cells. (A) Antiproliferative effect of nintedanib in cancer cells. Cells with wild-type p53 (HCT116, SJSA-1, SH-SY5Y, and MCF-7), mutant p53 (MDA-MB-453), or deleted p53 (HCT116) were incubated with indicated concentrations of nintedanib for 48 h, and the CCK-8 assay measured cell viability. (B) IC50 values of nintedanib in different cell lines (WT: wild type; DEL: deleted; MUT: mutant). (C and D) The effect of nintedanib on the SH-SY5Y cells migration. The data were presented as the means ± SD of three independent experiments. The significance of the differences was determined using one-way ANOVA with Bonferroni post-test. (* represents significant difference,*p < 0.05, ***p < 0.001).
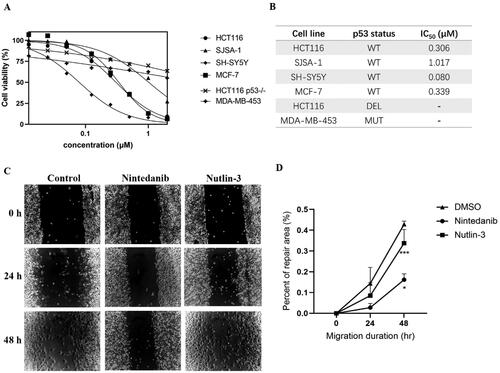
Figure 8. Nintedanib activates the p53 pathways in HCT116 cells. (A and B) RT-qPCR analysis of mRNA levels of p53 and targeted genes in HCT116 cells. Cells were treated with DMSO and indicated concentrations of nintedanib at different time courses. (C and D) Immunoblot of p53 and its downstream factors following treatment with DMSO and indicated concentrations of nintedanib at different time courses. GADPH was used as the loading control. Band intensities of blot C were calculated by Image J, and the bar graph was plotted and fitted by GraphPad Prism 8. (E and F) Immunofluorescence detection of p53. Red: Sulfo-Cyanine3 (CY3) staining shows the presence of p53 (red dots). Nuclei were counterstained with DAPI (blue). Scale bar =100 μm. Cells with p53 nuclear positive were quantified by counting 100 cells (magnification 200 ×) for each treatment. The data were presented as the mean ± SD of three experiments in all experiments. The result was normalised and statistically analysed in one-way ANOVA with Bonferroni post-test (*p < 0.05).
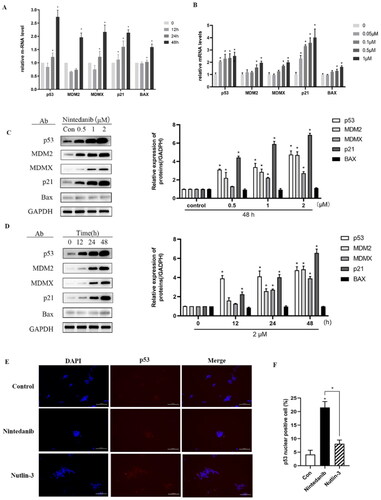
Figure 9. Nintedanib promotes cell cycle arrest in the G2/M phase of HCT116 cells. (A) Nintedanib induces cell cycle arrest in HCT116 cells. Cells were treated with DMSO, 1 or 0.2 μM of nintedanib, or 3 μM of nutlin-3 (positive control) for 48h. Cell cycle distribution was analysed by flow cytometry using PI staining (FL3-A). (B) The quantitative percentage of cells in cell cycle distribution. (C) Immunoblots and band intensities of cyclin B1 and CDK1 following treatment with the indicated concentrations of nintedanib for 48 h. (D) Immunoblots and band intensities of cyclin B1 and CDK1 following treatment with 2 µM of nintedanib at different time courses. The data were presented as the mean ± SD of three experiments in all experiments. The result was normalised and statistically analysed in one-way ANOVA with Bonferroni post-test (*p < 0.05).
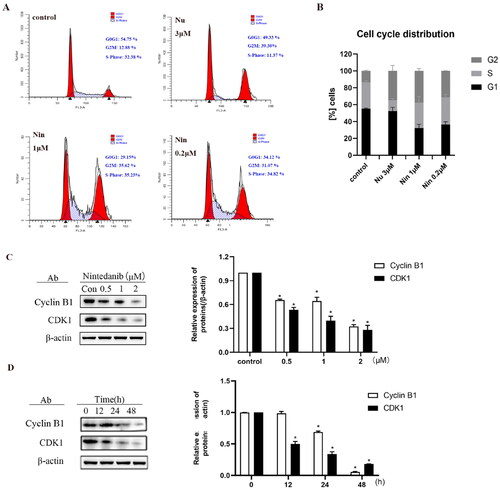
Figure 10. The proposed pathway for the antitumor effect of nintedanib.
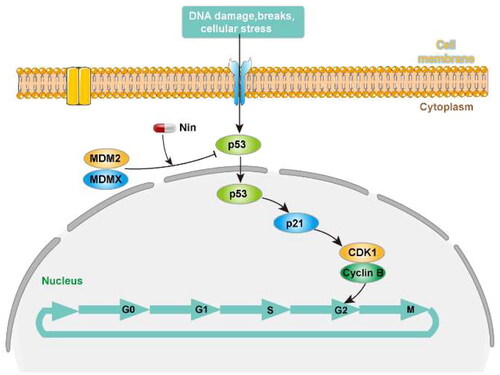
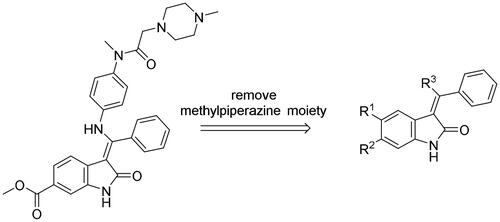
Figure 11. Minimisation of the chemical structure of nintedanib.
Scheme 1. Synthesis of H1-H11. Reagents and conditions: (a) chloroacetic anhydride, toluene, reflux; (b) trimethyl orthobenzoate, acetic anhydride, toluene, 110 °C; (c) KOH, MeOH, 60 °C; (d) amine derivatives, MeOH, DMF, and reflux.
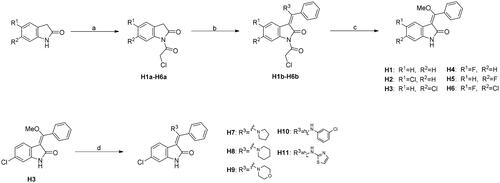
Table 3. Protein binding inhibition rate of each compound for MDM2 and MDMX.
Table 4. Antiproliferative activity of nintedanib derivatives in different cells.
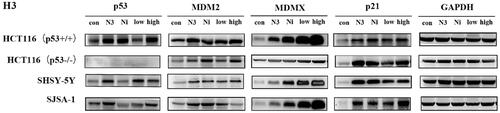
Figure 12. Effect of compound H3 on the level of related proteins. N3: nutlin-3 (5 μM); Ni: nintedanib (5 μM); low: H3 (5 μM); high: H3 (10 μM).