Figures & data
Scheme 1. Mechanistic diagram of NSD2/HDAC2 inhibitors in the treatment of HCC.
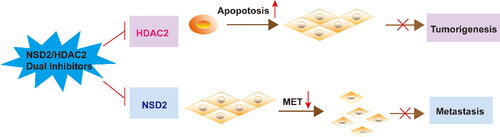
Figure 1. Structures of the representative NSD2 and HDAC inhibitors.
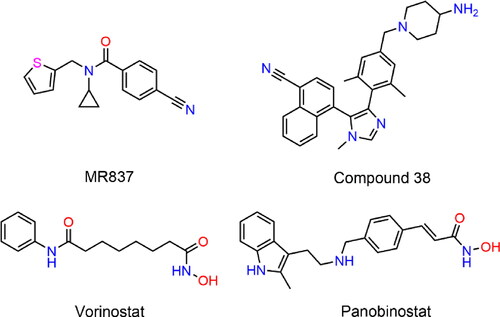
Figure 2. Details of the NSD2-based pharmacophore model features (F1: hydrophobic feature, F2 and F3: aromatic features, F4: hydrogen-bond acceptor feature).
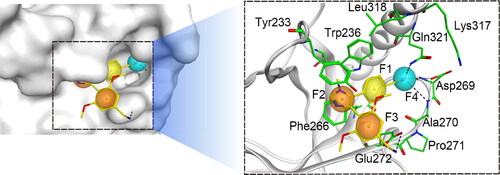
Table 1. The validation of the pharmacophore model by the GH scoring method.
Figure 3. Identification of hit compounds targeting NSD2 and HDAC2 through a comprehensive strategy of structure-based virtual screening and biological validation. (A) Workflow of the combinatorial screening and biological validation process of NSD2/HDAC2 dual-targeting inhibitors. (B) The docking validation of NSD2 before molecular docking (yellow indicates docking pose, and cyan indicates original pose). (C) The docking validation of HDAC2 before molecular docking (yellow indicates docking pose, and cyan indicates original pose). (D) Identification of five hit compounds with lower binding energies than both NSD2 (-10.51 kcal/mol) and HDAC2 (-12 kcal/mol).
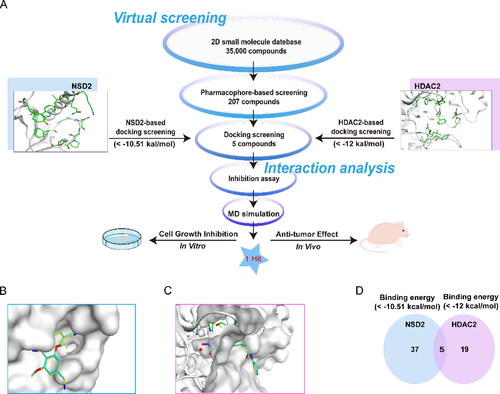
Figure 4. The chemical structures of five hit compounds.
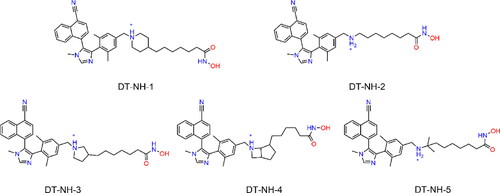
Table 2. The docking scores and enzymatic inhibitory activities of 5 hit compounds.
Figure 5. Predicted docking poses of five hit compounds at the NSD2 active site. Compounds in (A), (C), (E), (G), and (L) are represented by different colours (red for DT-NH-1, purple for DT-NH-2, brown for DT-NH-3, light pink for DT-NH-4, and cyan for DT-NH-5). (B), (D), (F), (H), and (M) are their corresponding surface maps. The coded green bars represent the active amino acid residues of NSD2. Hydrogen bonds are indicated by dashed black lines.
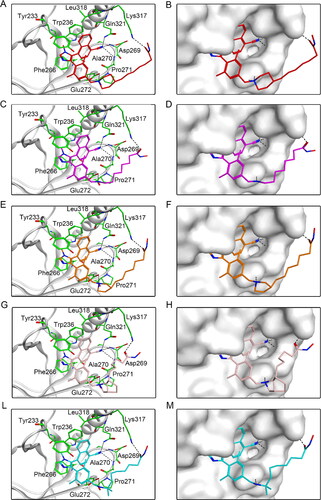
Figure 6. Predicted docking poses of five hit compounds at the HDAC2 active site. Compounds in (A), (C), (E), (G), and (L) are represented by different colours (red for DT-NH-1, purple for DT-NH-2, brown for DT-NH-3, light pink for DT-NH-4, and cyan for DT-NH-5). (B), (D), (F), (H), and (M) are their corresponding surface maps. The coded green bars represent the active amino acid residues of HDAC2. Hydrogen and ionic bonds are indicated by dashed black lines.
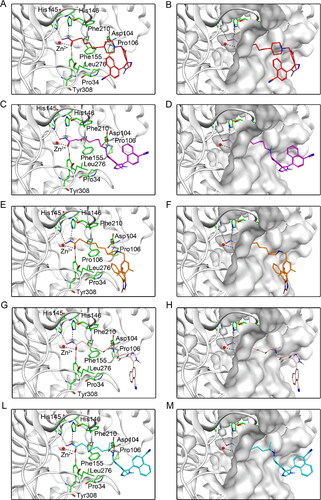
Figure 7. MD simulation of DT-NH-1 in complex with NSD2 and HDAC2. (A), (B) RMSD of NSD2-DT-NH-1 and HDAC2-DT-NH-1 complexes. (C), (D) RMSD of DT-NH-1 in NSD2-DT-NH-1 and HDAC2-DT-NH-1 complexes. (E), (F) RMSF of Cα atoms of NSD2 residues and HDAC2 residues respectively in NSD2-DT-NH-1 and HDAC2-DT-NH-1 complexes. (G), (H) The secondary structural analysis of DT-NH-1 in complex with NSD2 and HDAC2.
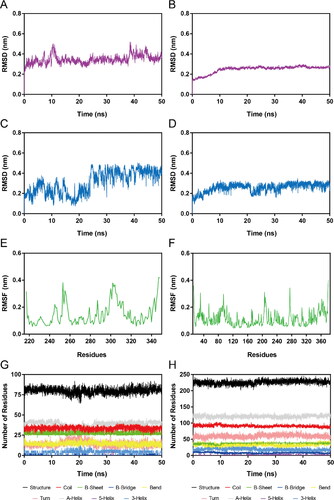
Figure 8. Inhibitory effects of five hits, MR837 and Vorinostat on HepG2 cells at a concentration of 0.6 μM. The results are representative of three independent experiments and are expressed as mean ± SD.
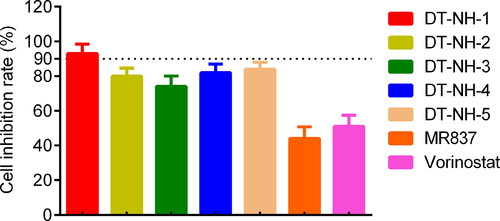
Figure 9. Inhibitory effects of DT-NH-1 on normal liver cell lines and four liver cancer cell lines. The results are representative of three independent experiments and are expressed as mean ± SD.
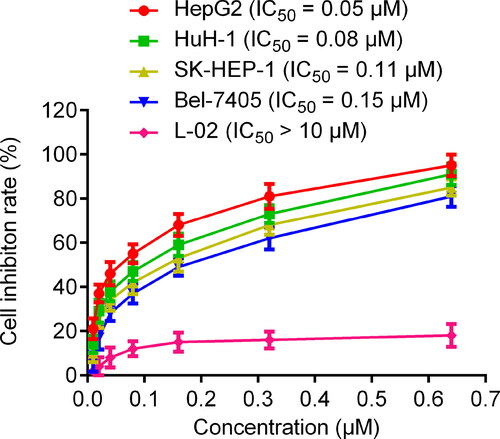
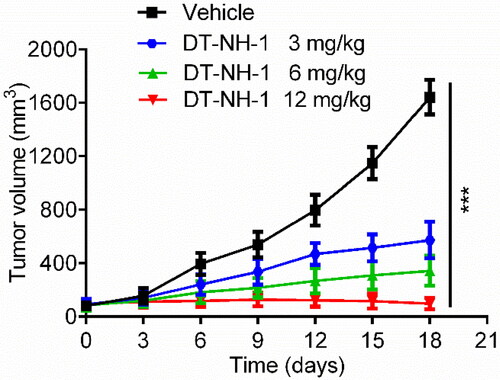
Figure 10. The change in tumour volume with varying concentrations of DT-NH-1. The results are presented as mean ± SD, n = 5. ***p < 0.001 mean significant difference versus the vehicle group.