Figures & data
Figure 1. BCAA metabolism-related pathways reveal the potential to target BCKDK for the development of inhibitors to treat diseases caused by BCAA accumulation. This figure shows the detailed process of BCAA metabolism. BCAAs enter the cell through large amino acid transporters (LATs) on the cell membrane, and their catabolism consists of two main steps. The first step is reversible transamination catalysed by branched-chain aminotransferases (BCATs), which include cytoplasmic BCATc and mitochondrial BCATm. BCAT transfers the α-amino group of BCAAs to the amino receptor, usually α-ketoglutarate (α-KG), resulting in the production of glutamate (Glu) and the corresponding branched-chain-α-keto acids (BCKAs), such as α-keto-β-methylvalerate (KMV), α-ketoisovalerate (KIV), and α-ketoisocaproate (KIC). The second step is the irreversible oxidative decarboxylation of BCKA, catalysed by branched-α-keto acid dehydrogenase (BCKDH) in mitochondria. This process generates the corresponding branched-chain acyl coenzyme A derivative (R-CoA), which enters the TCA cycle to provide energy to the organism. BCKDH comprises three subunits: E1, E2, and E3. When BCKDK (BDK) acts on the LBD structural domain of the E2 subunit of BCKDH, it phosphorylates the E1 α subunit, leading to the inactivation of BCKDH. Conversely, PP2Cm (BDP) plays a regulatory role in dephosphorylation and activation. Imbalances in the BCAA metabolic pathway are associated with the development of various diseases. Furthermore, the cross-talk between BCKDK of BCAA catabolism and the MAPK pathway promotes tumorigenesis in colorectal cancer. Additionally, leucine accumulation activates the mTORC1 signalling pathway, promoting protein and nucleic acid synthesis and contributing to tumour development. Therefore, screening for high-affinity and high-specificity BCKDK inhibitors could provide a research basis for the design and development of drugs to treat various diseases triggered by BCAA accumulation and upregulation of BCKDK.
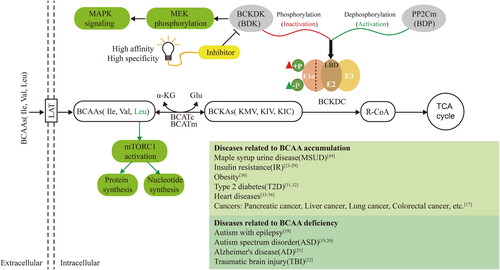
Figure 2. The virtual screening process for BCKDK inhibitors. The screening of BCKDK inhibitors consists of the following major parts: binding site prediction, structure-based virtual screening and bioactivity evaluation. (A–C) The results of allosteric site prediction based on the crystal structure of BCKDK. (A) Fifteen ligand binding sites were predicted by the CavityPlus server based on the crystal structure of BCKDK (PDB ID: 3TZ0). (B) The following sites are displayed: Site 4 represents the orthosteric site, Site 2 corresponds to the allosteric site reported in the literature, and Site 5 is a novel allosteric site selected in this study. (C) The orthosteric site contains the ADP structure shown in orange stick, while the targeted allosteric site (with key amino acid residues shown in green stick) is the focus of this study. (D) The specific screening steps for BCKDK inhibitors after determining the ligand binding site: Step 1: Screening 11.4 million compounds from the VirtualFlow Real Library, which contains 1.4 billion compounds, using custom ligand screening conditions. The predicted novel allosteric site (Site 5) was defined as the docking site (site space information: centre_x = 5.945, centre_y = -26.304, centre_z = 17.208, size_x/y/z = 22.4). Step 2: Employing the rigid docking software Qvina2 and Smina, 11.4 million compounds were docked into the target site. The top 25,000 compounds with the highest docking scores of each software were retained, resulting in a primary screening database of 47,702 compounds after eliminating duplicates. Step 3: Setting the amino acid residues within 8 Å of the binding site as flexible residues, the compounds in the primary screening database were docked using the platform’s own flexible docking software, Vina. The top 200 compounds were screened to form the fine screening database. Step 4: Hermite software was used to predict the ADMET properties of the compounds in the fine screening database. Based on the prediction of ADMET properties of the compounds through the Hermite Platform (https://hermite.dp.tech, DP Technology), compounds with high solubility, favourable bioavailability, and low toxicity were selected. Furthermore, considering the key interactions between the compounds and key amino acid residues in the receptor binding site, seven compounds that exhibited both hydrogen bonding and hydrophobic interactions were identified as theoretical hit compounds (hits). Step 5: Biological activity evaluation assays were performed on the hits, leading to the identification of three lead compounds. (E) The interactions between the seven hits and the key amino acid residues within the targeted site were examined. The compound structures are shown as yellow sticks, while the key amino acid residues within the site are indicated by green sticks. All these compounds can form hydrogen bond interactions with ARG371 or THR41 residues and occupy the hydrophobic cavity composed of TYR349, MET172, LEU46, and other crucial amino acid residues.
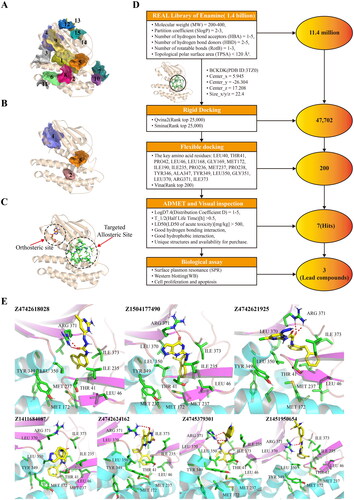
Table 1. Summary of the results of Cavity and CorrSite.
Figure 3. Lead compounds were screened using surface plasmon resonance (SPR) experiments and kinase activity assessment. (A) SDS–PAGE analysis of recombinant BCKDK-His6-tag protein, with a band size of the target protein equal to 47 kDa. (B) Fitting results obtained from surface plasmon resonance (SPR) experiments for the lead compounds. Dashed lines indicate the positions of Kd values. (C) Structure, custom abbreviated name, Enamine ID, and Kd values of each lead compound. In the compound structures, the red group represents the portion that forms hydrogen bonding interactions with key amino acid residues at the binding site, the blue group represents the segment that occupies the hydrophobic cavity of the site, and the black group serves as a linker. (D) The proliferation inhibition rate of 293T cells by PCAB, PPHN, POAB and BT2 at different concentrations from 0.05 μM to 500 μM. (E) Western blotting results after treating 293T cells with the compounds at a concentration of 40 μM for 48 hours. (F) Quantitative results based on the graph in (D), indicating that both compounds PPHN and POAB significantly inhibited the phosphorylation of BCKDHA by BCKDK, with a stronger inhibitory effect compared to that of BT2.
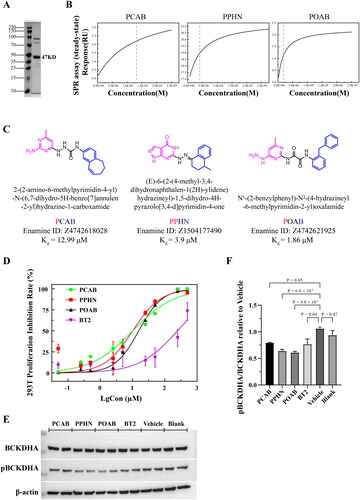
Figure 4. Effect of lead compounds on cell growth of normal 293 T cells and tumour cells (A549 and HCT116). (A) Cell viability results of different compounds (40 μM) measured using the CCK-8 assay after 24 hours, 48 hours, and 72 hours of treatment. All three lead compounds inhibited the proliferation of normal 293T cells, and compounds PPHN and POAB also inhibited the proliferation of A549 and HCT116 tumour cells. (B) Apoptosis analysis of different compounds (40 μM) on different cells, as measured using flow cytometry. Q1: Necrotic cells, Q2: Late apoptotic cells, Q3: Early apoptotic cells, Q4: Live cells. (C) Quantitative statistics of the apoptotic cells (Q2 + Q3) in the graph from (B). The compound PPHN demonstrated significant proapoptotic effects on all three cell types.
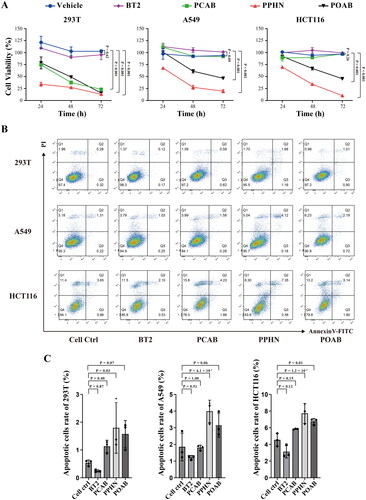
Figure 5. Comprehensive analysis of the results obtained from the bulk RNA-seq assay. (A) Heatmap illustrating the expression levels of some differentially expressed genes (DEGs) involved in BCAA metabolism. These genes were identified as being impacted by PPHN and POAB treatment across three distinct cell types at the transcriptome level. (B) Bubble plot highlighting the pathways that were specifically affected by PPHN and POAB and selected from the top 40 signalling pathways enriched with DEGs in Supplementary Figure 1. The analysis was performed using an adjusted p value cut-off of 0.05. The DEGs were derived from 293T, A549, and HCT116 cell lines treated with PPHN and POAB. The plot was divided into two columns representing downregulation and upregulation. The colour bar indicates the adjusted p value of the pathway, calculated using clusterProfiler. These results offer valuable insights into the molecular changes induced by PPHN and POAB, shedding light on their impact on cellular processes and potential therapeutic implications.
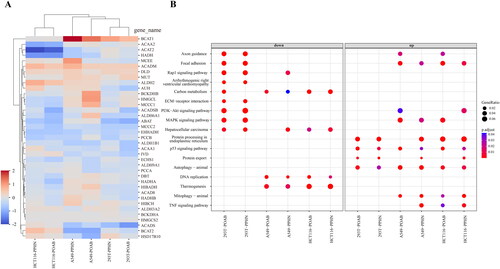
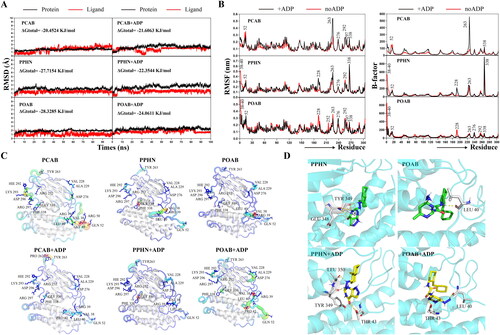
Figure 6. Molecular dynamics simulations between lead compounds and BCKDK in the presence and absence of ADP. (A) Time evolution of RMSD values of protein/ligand and total binding free energy for the six protein-ligand interaction systems. (B) RMSF values and B-factor scores during molecular dynamics simulations. The numerical labels in the figure correspond to the positions of the residues in the original crystal structure (PDB ID: 3TZ0). (C) The structures of the proteins are coloured according to their B-factor, and B-factor putty superimposed with cartoons is presented. Warmer colours (red) denote higher flexibility, and cooler colours (blue) indicate lower flexibility. (D) The conformation of PPHN and POAB within the allosteric site, along with their hydrogen bonding interactions with crucial amino acid residues, are shown during the steady state of the MD simulation. The compounds are depicted as green sticks to signify the absence of ADP, while yellow sticks represent the presence of ADP. The protein structure is illustrated in cartoon mode in cyan, while the essential amino acid residues are depicted as white sticks, and the yellow dashed lines indicate hydrogen bonds.