Figures & data
Scheme 1. Synthetic route for IBC derivatives. (i) DMF, CH3I or benzyl chloride, Na2CO3, 65 °C, 10–12 h. (ii) 25%NaOH, CHCl3, 30 °C, 9 h. (ii) Acetic acid, aminoguanidine carbonate, 50 °C, 5 h. (iv) MeCN, aldehydes, morpholine, 80 °C, 12 h.
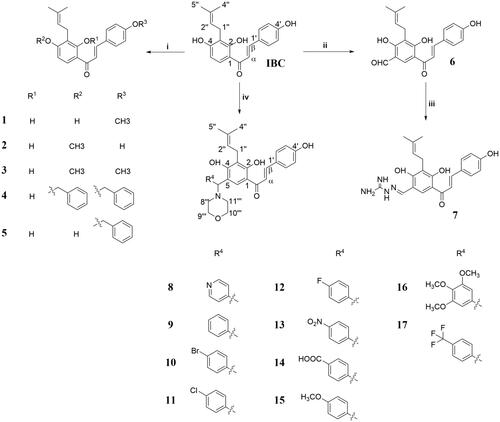
Table 1. Cytotoxic activity of compounds 1–17 and IBC (IC50, μM, 72 h).
Table 2. Cytotoxic activity of compound 16 on Aml-12 cells for 72 h (IC50, μM).
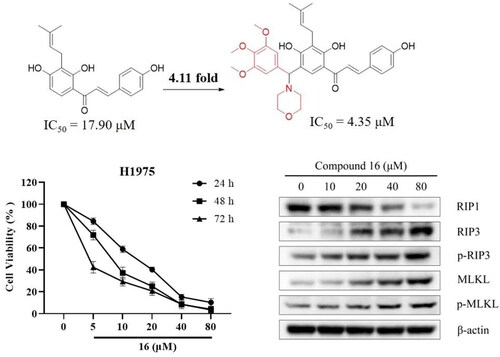
Figure 1. Inhibitory effect of compound 16 on cell viability in human lung cancer cells. (A) The cell viabilities of three human lung cancer (H1975, A549, and PC9) cells treated with various concentrations (0, 5, 10, 20, 40, and 80 μM) of 16 for 24, 48, and 72 h. (B) Effect of compound 16 on the ability of cells to form colonies in H1975 cells using a colony-formation assay. (C) Quantification of the colony-formation assay. *p < 0.05, **p < 0.01, and ***p < 0.001 compared with the control.
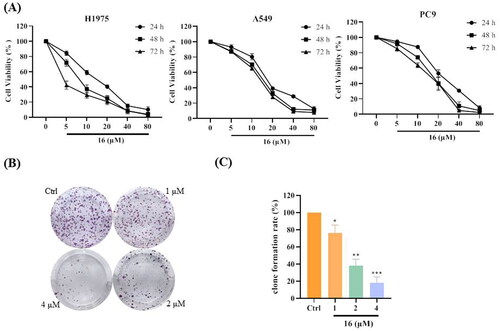
Figure 2. Compound 16 induced apoptosis in H1975 cells. (A) Flow cytometric analysis of cell death treated with different concentrations (10, 20, 40, and 80 μM) of 16 using Annexin V/PI dual staining. (B) H1975 cells were treated with 16 for 24 h, subjected to FITC and PI staining, and visualised using fluorescence microscopy. *p < 0.05, **p < 0.01, and ***p < 0.001 compared with the control.
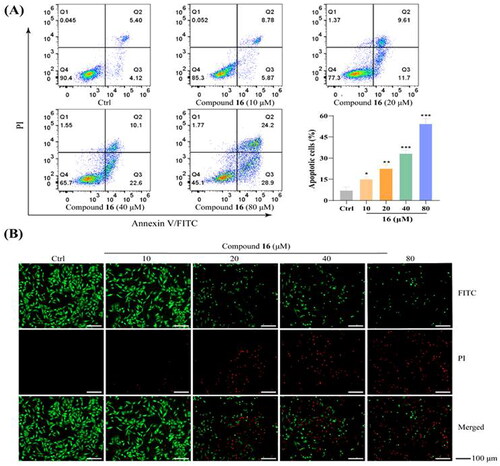
Figure 3. Compound 16 induced caspase-dependent apoptosis in H1975 cells. (A) Western blotting analysis of Bax, Bcl-2, Akt, and Cyt-C protein levels. (B) Western blotting analysis of caspase-9, and -3. (C) Cell viability following treated with compound 16 (40 μM) for 24 h alone or with pre-treatment with z-VAD (20 μM) as measured by MTT assay. **p < 0.01 compared with the control.
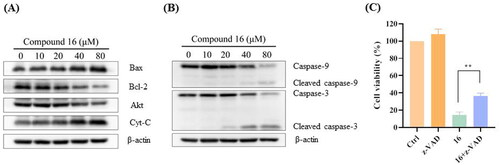
Figure 4. Compound 16 induced necroptosis in H1975 cells. (A) Morphological characteristics of the control using electron microscopy. (B) Morphological characteristics of 16-treated H1975 cells showing necrosis. Red arrowheads indicated cell nuclear chromatin condensation, massive mitochondrial damage, and disruption of plasma membrane. (C) Western blotting analysis of RIP1, RIP3, p-RIP3, MLKL, and p-MLKL protein levels. (D) Cell viability following treated with compound 16 (40 μM) for 24 h alone or with pre-treatment with Nec-1 (20 μM) and NSA (20 μM) as measured by MTT assay. *p < 0.05 and **p < 0.01 compared with the control.
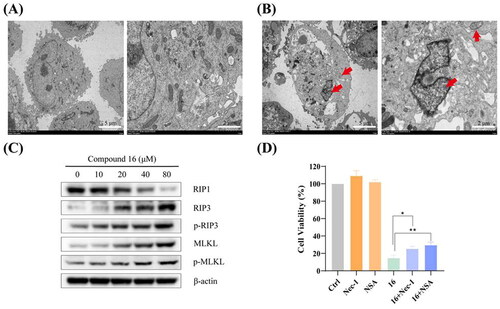
Figure 5. Knock-down of RIP3 using siRNA protected against compound 16 induced cell death in H1975 cells. (A) The H1975 cells were transfected with RIP3 siRNA, and whole-cell lysates were subjected to western blot analysis. (B) After transfection with RIP3 siRNA1171, the cells were treated with compound 16 (40 μM) for 24 h, alone or with pre-treatment with Nec-1. The cell viability was measured by MTT assay. *p < 0.05 compared between the groups of compound 16 and 16 with Nec-1.
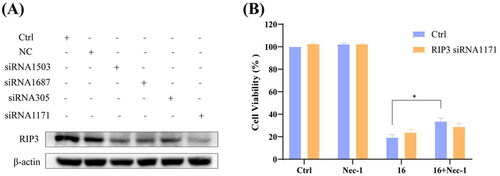
Figure 6. Effect of compound 16 on mitochondrial function in H1975 cells. (A) Mitochondrial membrane potential was assessed by JC-1 staining and flow cytometry. (B) Quantification of the green fluorescence. (C) Cellular ATP levels after treated with different concentrations (10, 20, 40, and 80 μM) of 16 for 6 h. (D) Intracellular ROS levels after treated with various concentrations of 16 for 6 h. (E) Intracellular ROS level analysis following treated with 16 with or pre-treatment with NAC (20 μM). (F) Cell viability following treated with 16 (40 μM) for 24 h alone or with pre-treatment with NAC as measured by MTT assay. *p < 0.05, **p < 0.01, and ***p < 0.001 compared with the control.
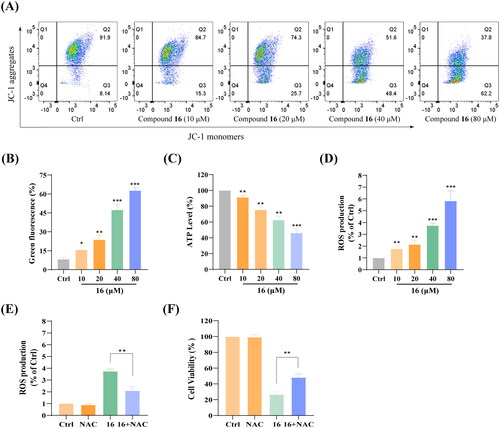
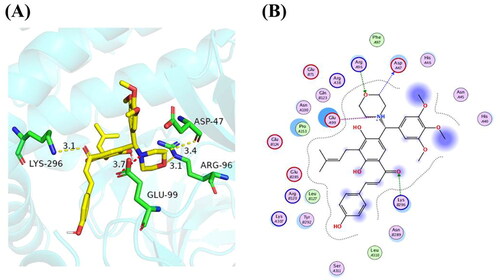
Figure 7. Molecular docking model of compound 16 on RIP3 protein. (A) 3D-binding model of compound 16 with RIP3 according to molecular docking analysis by MOE. (B) 2D-docking model of compound 16 with RIP3.