Figures & data
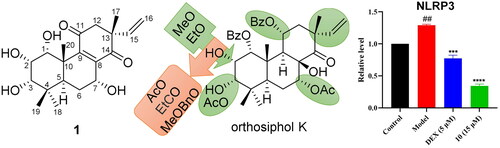
Figure 1. Chemical structures of diterpenoids 1 − 8 isolated from O. aristatus.
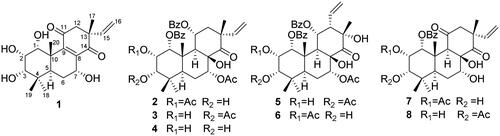
Figure 2. 1H-1H COSY (bold lines), HMBC (blue arrows), and NOESY (dash line arrows) correlations of compound 1.
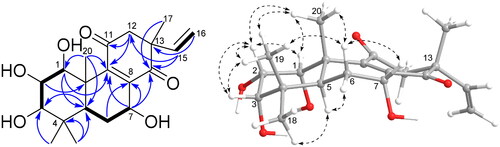
Table 1. 1H and 13C NMR spectral data (500 MHz for 1H and 125 MHz for 13C in methanol-d4) of compound 1 (δ in ppm, J in Hz).
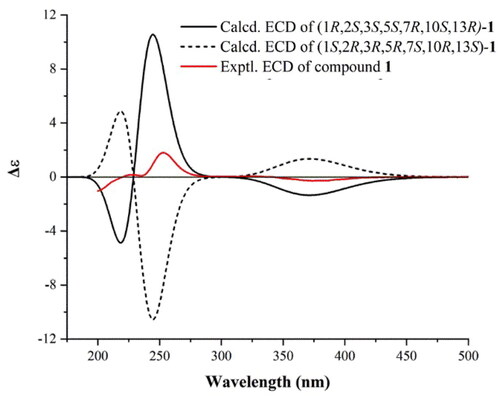
Figure 3. Experimental ECD curve of compound 1 (solid red line), and M062X/TZVP//B3LYP/6-31G(d) calculated ECD spectra of 1 R,2S,3S,5S,7R,10S,13R-1 (solid black line) and 1S,2R,3R,5R,7S,10R,13S-1 (dash black line).
Scheme 1. Structures and reactions in modifications of orthosiphol K (4).a
a Reagents and conditions: (a) Cs2CO3, DMF, 3-OMePhCH2Br, 80 °C, reflux; (b) Cs2CO3, DMF, CH3CH2Br, 80 °C, reflux; (c) Propanoic acid, DMAP, EDCI, CH2Cl2, 0-25 °C,6h; (d) Cs2CO3, DMF, MeI, r.t., 24h; (e) Jones reagent, acetone, 0-25 °C, 1.5-2h; (f) NH4OH/MeOH, 110 °C, reflux, 0.5-1h.
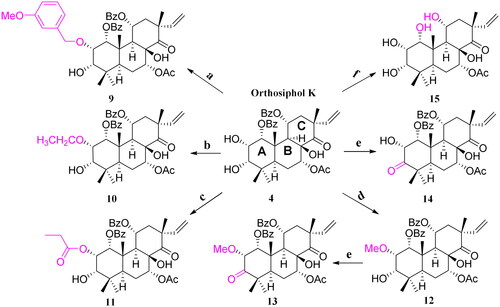
Figure 4. Cytokine release levels in TNF-α-induced MH7A cell model. (A) IL-1β release levels. (B) IL-6 release levels (####p < 0.0001, vs. control group; *p < 0.05, **p < 0.01, ***p < 0.001, ****p < 0.0001, vs. model group).
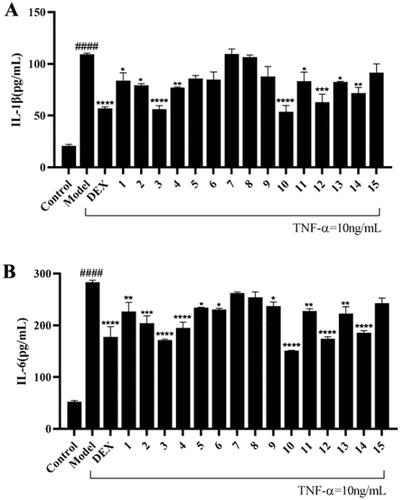
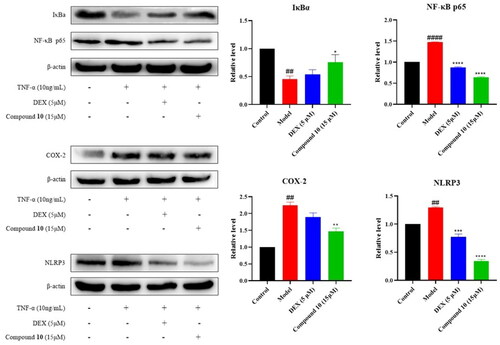
Figure 5. Effect of compound 10 on TNF-α-induced IκBα, NF-κB p65, COX-2, and NLRP3 protein expression in MH7A cells. (A) Western blot analysis and (B) Quantified protein expression levels. (#p < 0.05, ##p < 0.01, ####p < 0.0001, vs control group; *p < 0.05, ***p < 0.001, ****p < 0.0001, vs. model group).