
Figures & data
Figure 1. Schematic diagram of the workflow of this study.
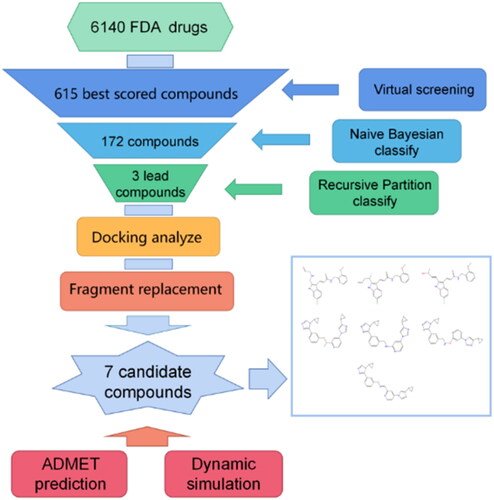
Figure 2. Internal/external validation ROC curves and confusion matrix for the Naive Bayesian model. (A)Confusion matrix for 10-fold validation of the model internal; (B) ROC curve for 10-fold validation of the model internal; (C) Confusion matrix for the internal external test of the model; (D) ROC curve for the external test of the model.
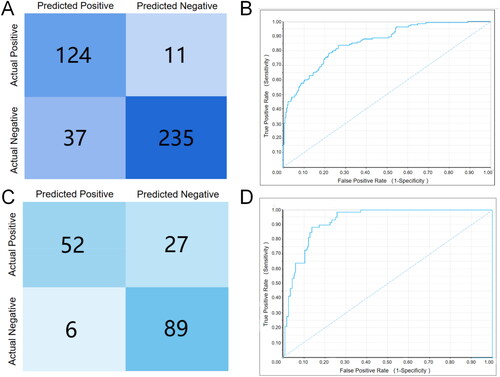
Table 1. Internal/external validation of the Naive Bayesian model.
Figure 3. Confusion matrices for in-bag/out-of-bag validation/test set validation of the Recursive Partition model. (A) Confusion matrix for model in-bag validation; (B) Confusion matrix for model internal out-of-bag validation; (C) Confusion matrix for model test set validation.
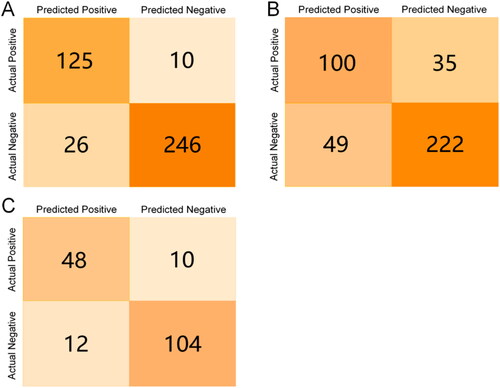
Table 2. In-bag/out-of-bag validation of the Recursive Partition model.
Table 3. Structure, Libdock and CDOCKER energy scores of the three lead molecules and the control inhibitor i472.
Table 4. Novel molecules obtained by i472 fragment replacement optimisation.
Table 5. Structural and target interaction information for OSI-930 and its fragment replacement optimised molecule osia - osif.
Table 6. Structural and target interaction information for GS-444217 and its fragment substitution optimised molecule gsa–gsh.
Figure 4. Structural superposition schematic of candidate compounds.
(A) Structural overlay of gsa/b/c/e, gsa is earthy yellow, gsb is red, gsc is purple, and gse is green; (B) Schematic representation of the binding of gsa/b/c/e to the active pocket of ALOX15 protein; (C) Structural overlay of i472a/b/e, i472a is cyan, i472 is orange, and i472e is grey; (D) Schematic representation of the binding of i472a/b/e to the active pocket of ALOX15 protein.
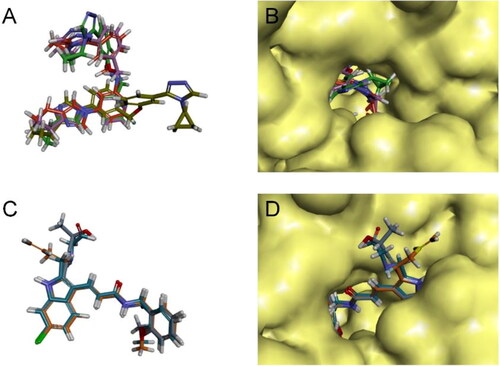
Figure 5. Final selection of the lead compound structure.
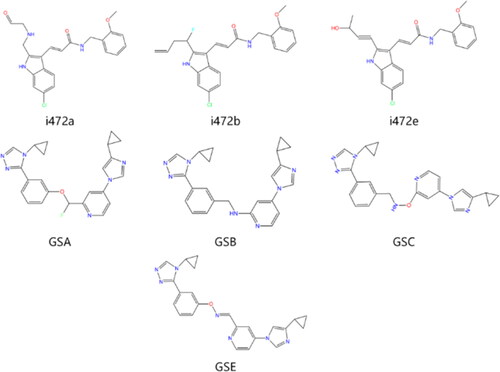
Table 7. ADME test results for the seven lead molecules.
Table 8. Results of teratogenicity, carcinogenicity to male/female Rat tests for seven lead molecules.
Figure 6. Molecular dynamics simulations of the seven candidate molecules in complex with ALOX15 protein. (A)fluctuations in the root mean square deviation of the ligand; (B) fluctuations in the root mean square fluctuation of the protein residues forming the complex; (C) fluctuations in the radius of gyration of the protein receptor; (D) fluctuations in the potential energy of the complex system.
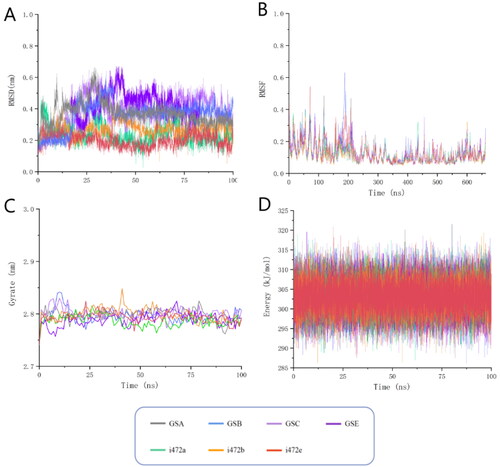
Figure 7. Number of interactions between 7 candidate molecules and ALOX15 protein over time. (A) Number of interactions between gsa and protein over time; (B) Number of interactions between gsb and protein over time; (C) Number of interactions between gsc and protein over time; (D) Number of interactions between gse and protein over time; (E) Number of interactions between ia and protein over time; (F) Number of interactions between ib and protein over time; (G) Number of interactions between i.e. and protein over time. number of interactions over time; (G) number of interactions between i.e. and proteins over time.
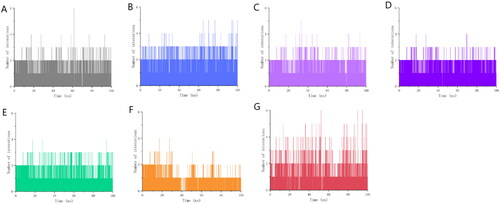
Table 9. Binding energy of between the candidate compounds and ALOX15.
Supplemental Material
Download PDF (1.9 MB)Data availability
The data that support this study are available from the corresponding author upon reasonable.