Figures & data
Figure 1. Some knowing CDC7 inhibitors A) ATP-competitives inhibitors and B) allosteric modulator.
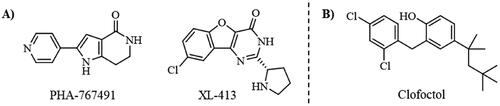
Figure 2. Representative CDC7 structure with the most conserved and druggable cavities found by Fpocket.
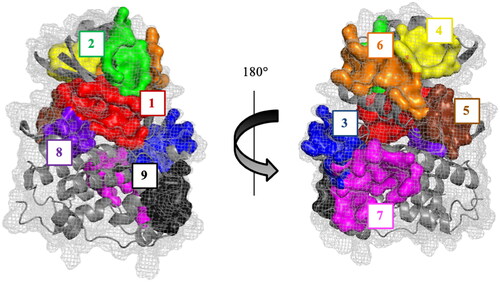
Table 1. Druggable binding sites. Numbering refers to the priority given by the fpocket. Two or more numbers indicate that the overall pocket is detected as different two or more cavities.
Figure 3. Superposition of the fpocket results with the human CDC7 crystal structure in complex with ADP (PDB code: 4F9A), PHA-767491 (PDB code: 4F9B), and XL413 (PDB code: 4F9C) inhibitors.
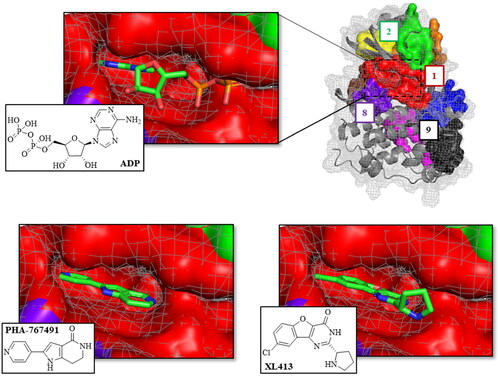
Table 2. Docking score and MMGSBA energy values of CDC7 control inhibitors in different surface pockets.
Figure 4. Superposition of the pockets 2, 4, 6, and 9 with the human CDC7-DBF4 crystal structure (PDB code 4F9A). The regulatory subunit (DBF4) is represented in pink (motif M) and cyan (motif C).
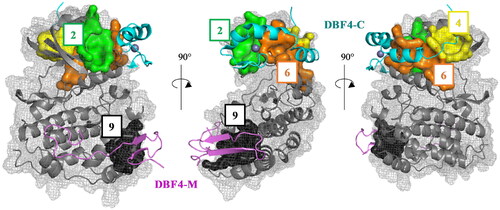
Figure 5. Details of the interface between the DBF4 motif C (green) and the αC helix of CDC7 N lobe (orange). Most important residues are represented in colours.
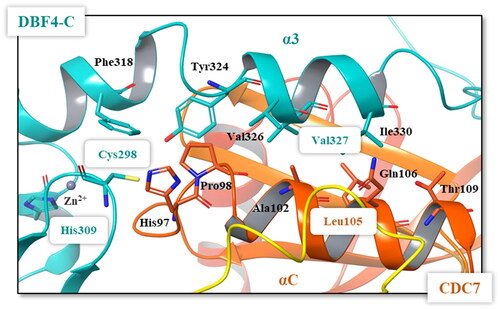
Figure 6. Sequence logo analysis of pockets 1 (catalytic site), 2 and 6 using the multiple sequence alignment (MSA) of 497 human protein kinome reported in 2019Citation35. Logos were obtained with the WebLogo serverCitation40. Each logo consists of stacks of symbols, one stack for each position in the MSA. The overall height of the stack indicates the sequence conservation at that position, while the height of symbols within the stack indicates the relative frequency of each amino at that position, indicated as % below CDC7 residues.
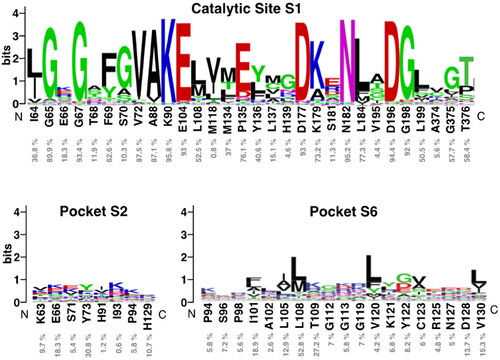
Figure 7. A) Superposition of clofoctol in pockets 6 and 2; B) virtual screening results of MBC library in these two pockets.
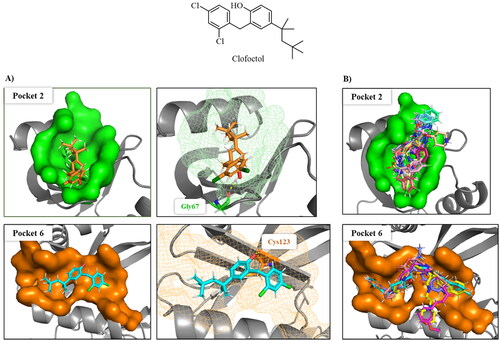
Table 3. Selected molecules from virtual screening as allosteric modulators of CDC7.
Figure 8. Kinase-Glo assay was used to screen compounds for activity against CDC7-DBF4 kinase. A) CDC7 activity in the presence of compounds at 10 uM. Clofoctol (allosteric inhibitor, 20 uM) and PHA (ATP-competitive inhibitor, 10 uM) were used as controls. B) Graph represents the IC50 of PHA. The activity is proportional to the difference of the total and consumed ATP. The inhibitory activities were calculated based on maximal activities measured in the absence of inhibitor. Bars are the mean ± SD of three independent experiments. Statistical analysis was performed using One-way ANOVA followed by Bonferroni’s post-test (****p < 0.0001).
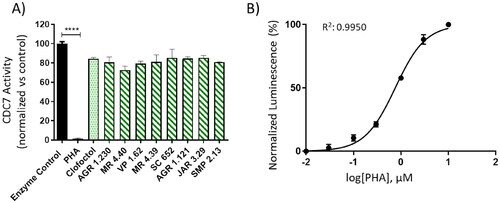
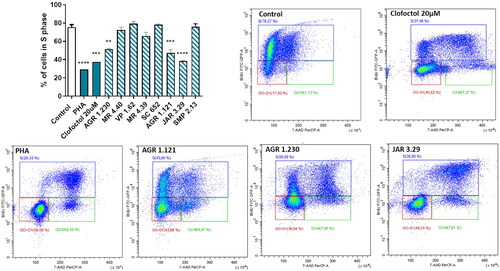
Figure 9. Compounds effect on cell cycle distribution shown by BrdU incorporation assay in SH-SY5Y cell line. Cells were treated with Clofoctol, PHA and studied compounds (10 µM) for 24h. The treated cells were pulsed with 20 μM BrdU in culture medium 4h after compounds treatment and conducted by FITC-BrdU Flow Kit. Graph represents the percentages of cells in S phase. FACS analysis was performed to demonstrate cell cycle distribution: G0/G1 phase (red region) S phase (blue region) and G2/M phase (green region). Plots of positive compounds are shown (BrdU: Y-axis and 7-AAD: X-axis). Bars are the mean ± SD of three independent experiments. Statistical analysis was performed using One-way ANOVA followed by Bonferroni’s post-test (**p < 0.01; ***p < 0.001; ****p < 0.0001).