Figures & data
Figure 1. SaSDH purification. (A) Chromatogram from AKTA pure. (B) SDS-PAGE: lane 1: bacterial medium; lane 2: bacterial precipitate; lane 3: sample flow through column; lane 4 and lane 5: SaSDH eluted with 100 mM imidazole; lane 6: marker.
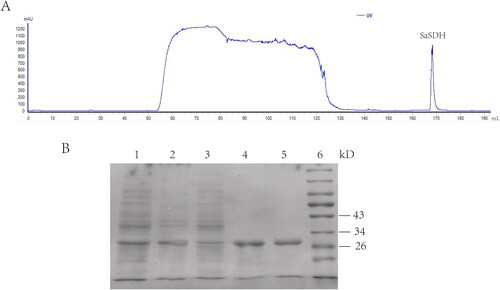
Figure 2. (A) SaSDH activity. Activity was determined by continuous monitoring of the increase of NADPH concentration at 340 nm. (B) Reciprocal plots of initial velocities under conditions where either NADP or SHK was varied at different fixed concentrations of the co-substrate.
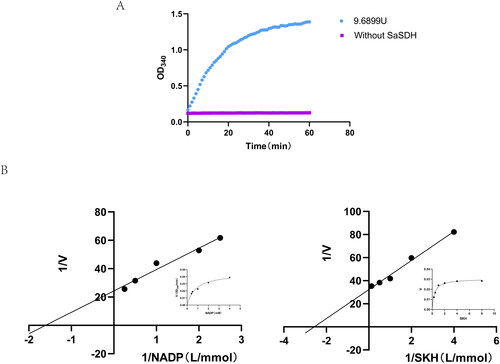
Table 1. Apparent kinetics parameters for SaSDH.
Figure 3. Homology modelling. (A) 3D model of SaSDH. (B) Ramachandran plot obtained from model protein geometry evaluation (dark green, light green, and green correspond to the favoured, allowed and outlier regions respectively). (C) Normalised QMEAN4 score graphic showing the position (red cross) of the model in the set of PDB structures used for the evaluation and the Z-score value.
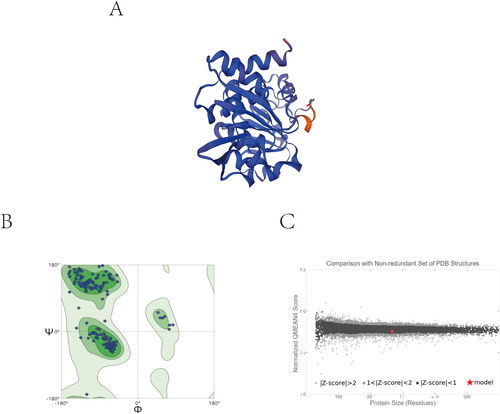
Table 2. Inhibition of SaSDH and S. aureus MICs for 12 compounds.
Figure 4. Double-reciprocal plot of initial velocities versus substrate concentration in the presence of different concentrations of (-)-Gallocatechin gallate and Rhodiosin.
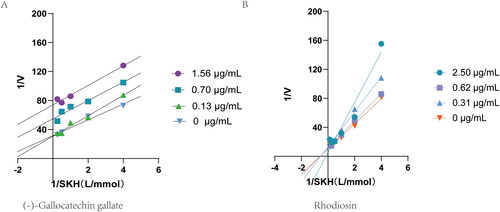
Figure 5. (A) Molecular docking of (-)-Gallocatechin gallate and Rhodiosin with SaSDH. (B) Binding isotherm of SaSDH titrated with (-)-Gallocatechin gallate and Rhodiosin.
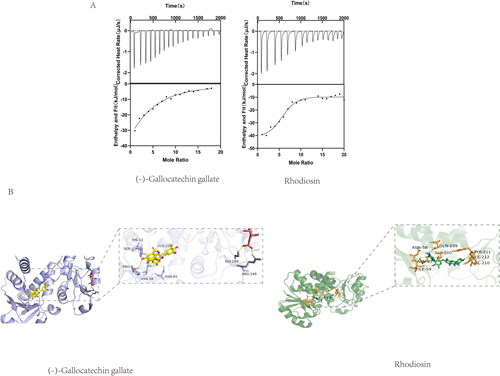
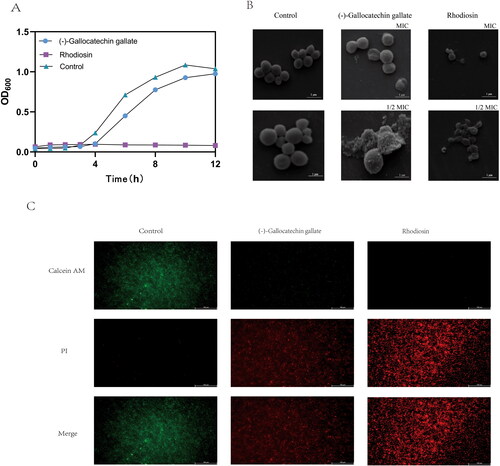
Figure 6. Antibacterial action of (-)-Gallocatechin gallate and Rhodiosin.(A) Time-Kill curves for (-)-Gallocatechin gallate and Rhodiosin against S.aureus.(B) SEM of S.aureus treated with (-)-Gallocatechin gallate and Rhodiosin.(C) Calcein AM/PI staining of S.aureus treated with (-)-Gallocatechin gallate and Rhodiosin.