
Figures & data
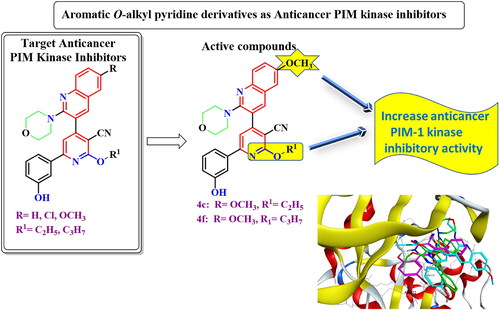
Figure 1. Previously discovered pyridone derivatives as PIM-1 kinase inhibitors.
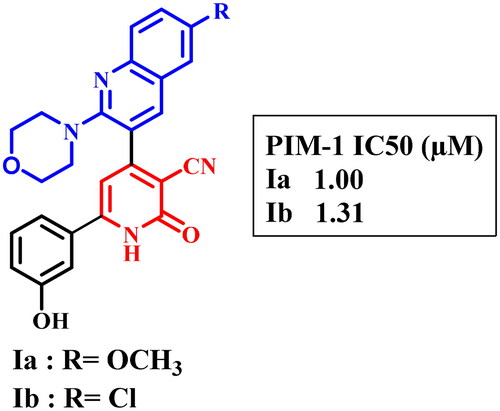
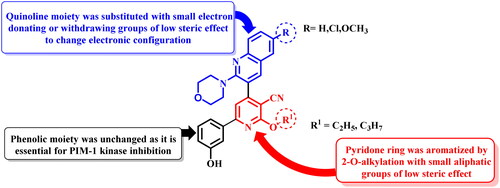
Figure 2. Design of aromatic O-alkyl pyridine derivatives.
Scheme 1. Synthesis of O-alkylpyridine derivatives.
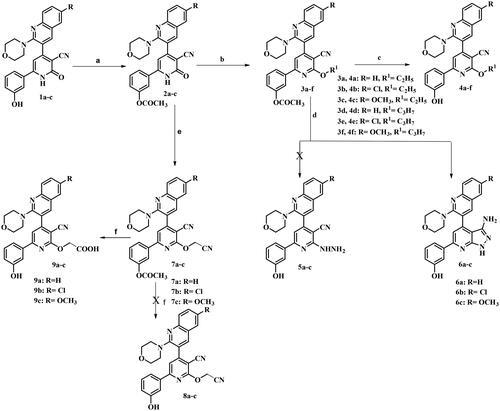
Figure 3. Proposed mechanism for formation of 3-aminopyrazolo[3,4-b]pyridine derivatives 6a–c.
![Figure 3. Proposed mechanism for formation of 3-aminopyrazolo[3,4-b]pyridine derivatives 6a–c.](/cms/asset/cbfdd290-ddd9-48c6-8bd8-340981719deb/ienz_a_2304044_f0003_b.jpg)
Figure 4. IC50 and EC100 (μM) of the tested compounds against normal human cells (wi-38) after 72 h incubation.
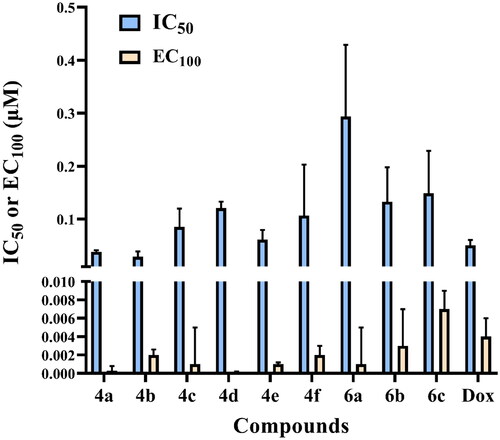
Figure 5. In vitro anticancer activity, IC50 (μM), of the tested compounds against human cancer cells after 72 h incubation.
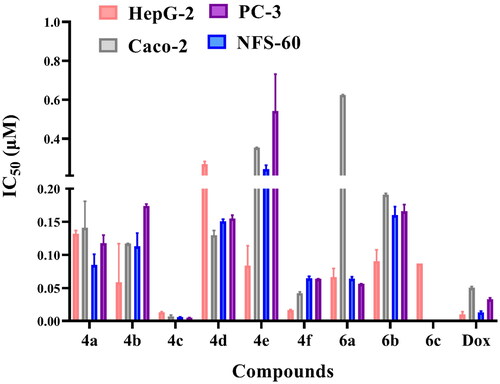
Figure 6. Morphological alterations of the most active compounds (0.06 µM)-treated cancer cells lines in comparison with the untreated cancer cells after 72 h incubation.
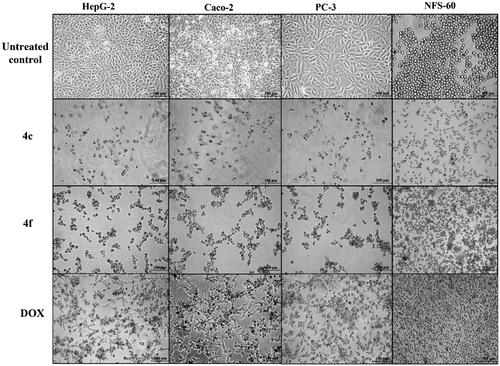
Figure 7. Flowcharts of Annexin-PI analysis of 4c and 4f – treated cancer cell lines in comparison with the untreated cancer cells after 72 h incubation at concentrations equivalent to 0.013, 0.007, 0.005, and 0.006 µM, respectively.
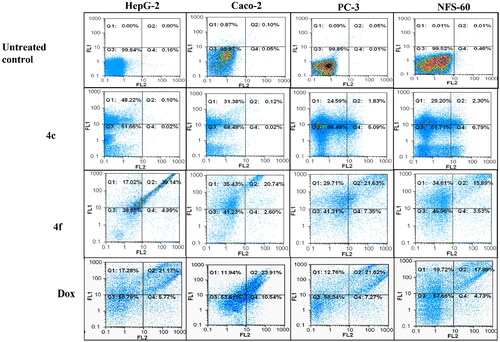
Table 1. The total percentage of the apoptotic cell population in the most effective compounds-treated cancer cells lines.
Table 2. Relative fold increase in caspase activity by the most effective compounds relative to untreated HepG2 cancer cells.
Table 3. In vitro PIM-1 kinase inhibition data of the most active compounds.
Figure 8. Lineweaver–Burk double-reciprocal plot for PIM-1 kinase inhibition by 4c and 4f in comparison with quercetin as reference inhibitor in the presence of ATP.
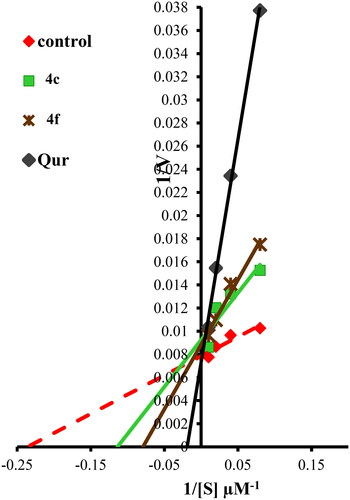
Figure 9. Left: Co-crystallised ligand, ligand–enzyme interaction (2D). Right: Overlay of crystallised ligand (magenta) and docked ligand (yellow) with RMSD = 1.431 (3D) inside PIM-1 kinase active site.
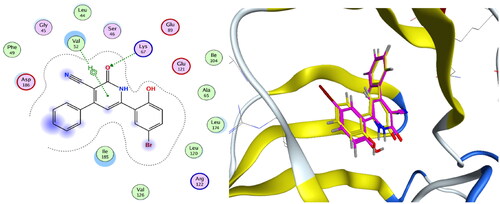
Figure 10. 4c, ligand–enzyme interaction 2D (left) and 3D (right) inside PIM-1 kinase active site.
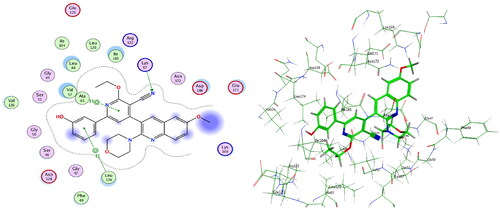
Figure 11. 4f, ligand–enzyme interaction 2D (left) and 3D (right) inside PIM-1 kinase active site.
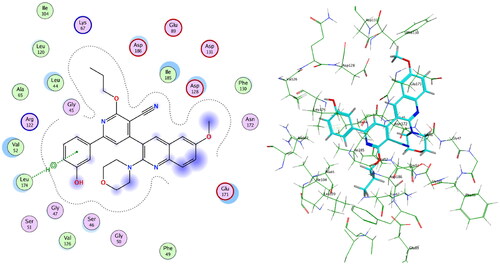
Figure 12. Overlay of 4c (green), 4f (cyan), and ligand (magenta) inside PIM-1 kinase active site.
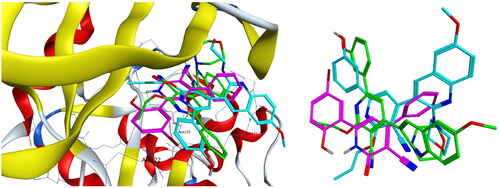
Table 4. Induced fit docking results of the active compounds inside PIM-1 kinase active site.
Table 5. LE and LLE values for the most active anticancer compounds against PIM-1 kinase enzyme.