Figures & data
Figure 1. Chemical structures of some CDK8 inhibitors.
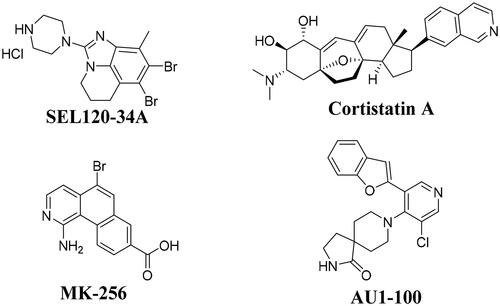
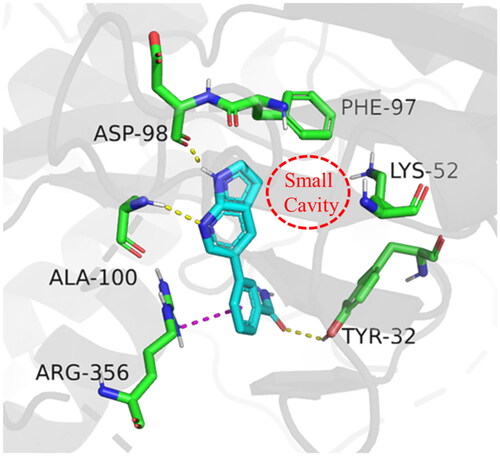
Figure 2. Binding mode of compound C43 with active site of CDK8 (PDB: 5IDN). CDK8 is shown in gray ribbons with selected residues coloured green. Hydrogen bonds are drawn as yellow dashed lines, and pi-pi stacking is drawn as magenta dashed lines. Compound 43 is shown with blue stick. The illustration was generated using PyMOL.
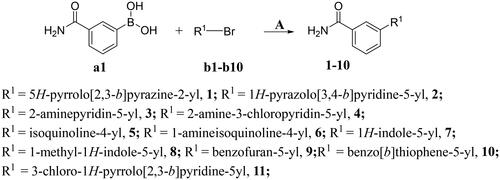
Scheme 1. Synthesis of compounds 1-11a
aReagents and conditions: A. K2CO3, Pd(dppf)Cl2, 1,4-dioxne, H2O, 85 °C, 14 h.
Scheme 2. Synthesis of compounds 12-40a
aReagents and conditions: A. K2CO3, Pd(dppf)Cl2, 1,4-dioxne, H2O, 85 °C, 14 h; B. NaOH, THF, H2O, 35 °C, 6 h; C. DMF, NIS, 85 °C, 12 h; D. NaOH, CH3CH2OH, H2O, 75 °C, 2 h.
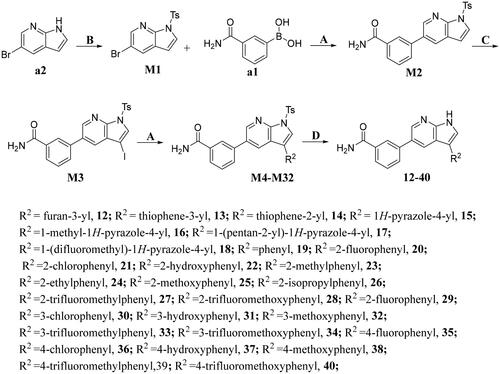
Table 1. The evaluation of the activity of compounds 1-10 on CDK8.
Table 2. The evaluation of the activity of compounds 11-40 on CDK8.
Figure 3. Molecular docking of target compounds. (A) The docking model of compound 12 with CDK8 (B) Superposition of spatial structures of compound C43 and 12 within active site of CDK8 (PDB: 5IDN). CDK8 is shown in gray ribbons with selected residues coloured green. Hydrogen bonds are drawn as yellow dashed lines, and pi-pi stacking is drawn as magenta dashed lines. Compound 12 is shown with yellow stick and compound C43 is shown with blue stick. The illustration was generated using PyMOL.
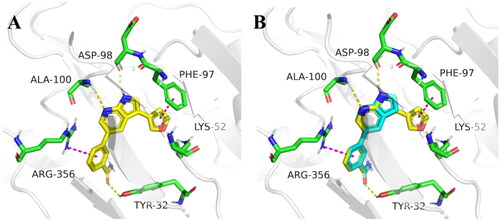
Table 3. Antiproliferative activity and preliminary safety of selected compounds.
Table 4. CDKs Selectivity of Compound 12.
Figure 4. Compound 12 enhanced the thermal stability of intracellular CDK8 protein. (A-B)The CDK8 protein intensity at different temperature.
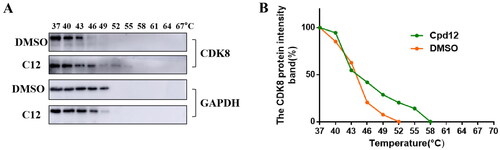
Figure 5. Compound 12 and biotin bind to CDK8 protein competitively. (A) Compound 12 binds to CDK8 protein in HCT-116 cells. (B)Compound 12 binds to CDK8 protein in HEK293T cells.
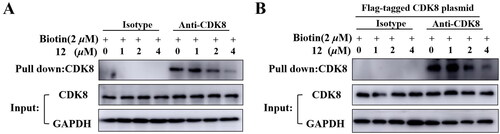
Figure 6. Compound 12 inhibited phosphorylation of STAT1 S727 and STAT5 S726. (A) Compound 12 suppressed the phosphorylation of STAT1 S727 in a dose-dependent manner. HCT-116 cells were treated with compound for 12 h. (B) Compound 12 suppressed the phosphorylation of STAT5 S726 in a dose dependent manner. HL-60 cells were treated with or without compound for 12 h. The samples were analysed by Western blot.
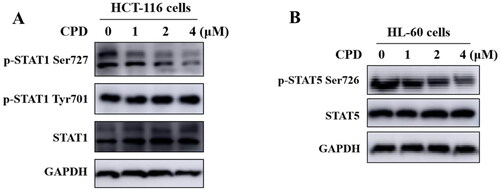
Figure 7. (A-B) The concentrations versus time curve of compound 12.
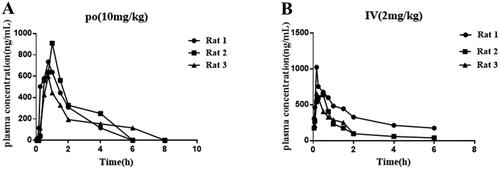
Table 5. In vivo PK properties of compound 12.
Table 6. Caco-2 permeability determination.
Table 7. CYP inhibition activity.
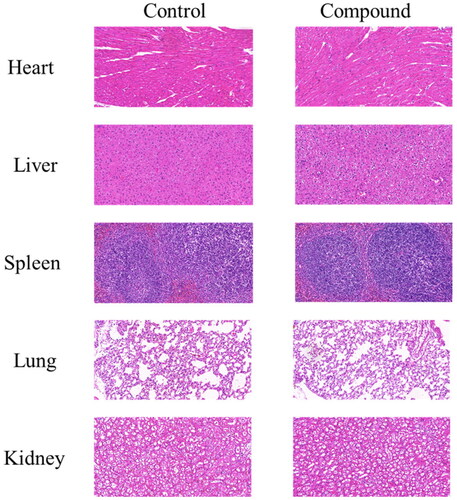
Figure 8. Compound 12 had low toxicity in vivo. The HE staining of tissues after mice were treated with 1000 mg/kg compound 12. The scan bar: 100 μM.