Figures & data
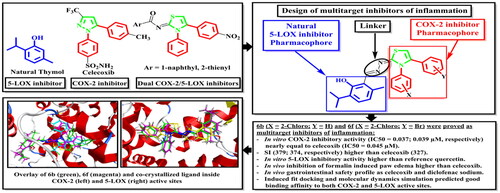
Figure 1. Structures of compounds having COX-2, or 5-LOX inhibitory activities.
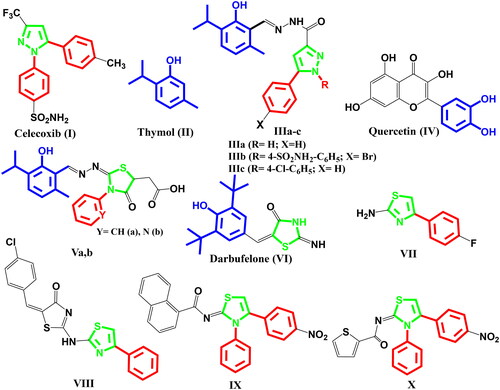
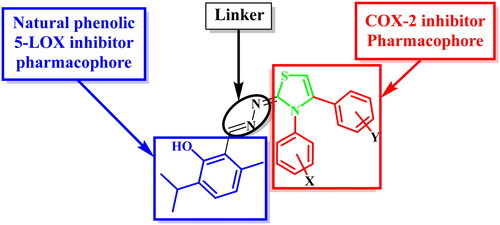
Figure 2. Design of thymol—3,4-disubstitutedthiazole hybrids as dual COX-2/5-LOX inhibitors.
Scheme 1. Synthesis of the target thymol—3,4-disubstitutedthiazole hybrids.
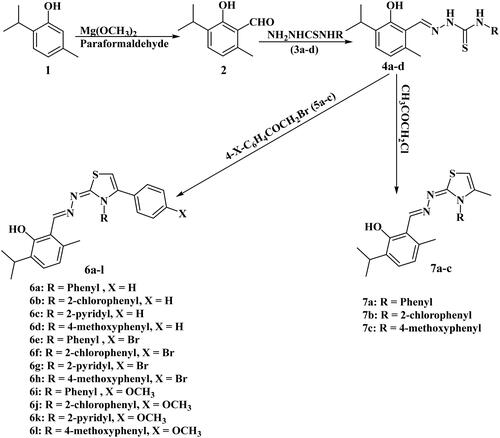
Table 1. In vitro COX-1, COX-2, and 5-LOX enzyme inhibitory activities, aIC50 values and bSI of the tested compounds.
 .
.
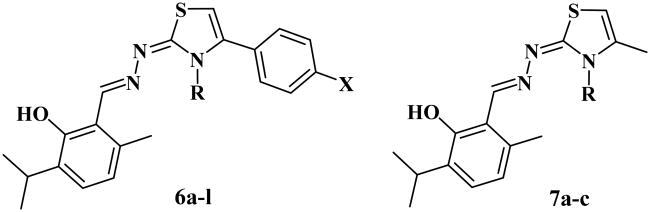
Figure 3. % Inhibition of formalin-induced paw edoema.
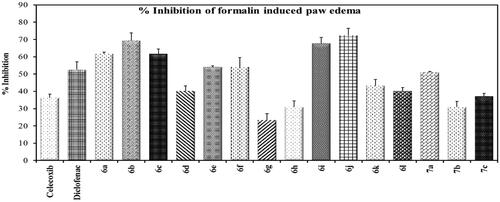
Figure 4. Histological analysis of rats’ stomach sections stained with H&E (100x magnification).
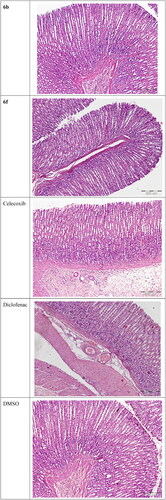
Figure 5. Left: co-crystallized celecoxib, ligand-enzyme interaction (2D). Right: Overlay of co-crystallized celecoxib (yellow) and docked celecoxib (cyan) with RMSD = 0.422 (3D) inside COX-2 active site.
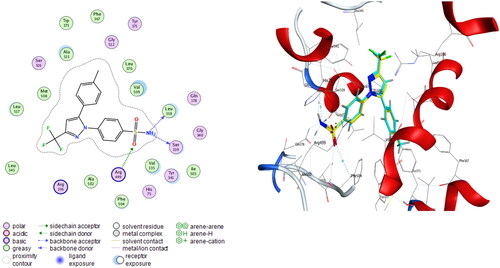
Figure 6. 6b, ligand–enzyme interaction 2D (left) and 3D (right) inside COX-2 active site.
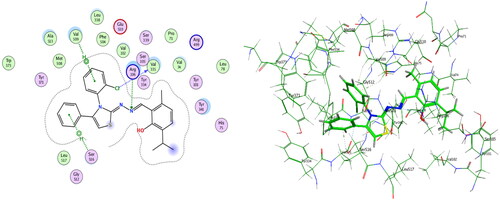
Figure 7. 6f, ligand–enzyme interaction 2D (left) and 3D (right) inside COX-2 active site.
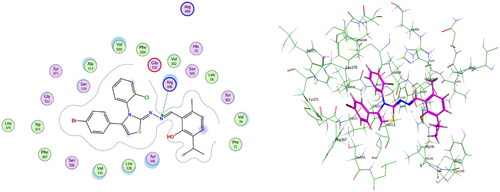
Figure 8. Overlay of 6b (green), 6f (magenta), and celecoxib (cyan) inside COX-2 active site.
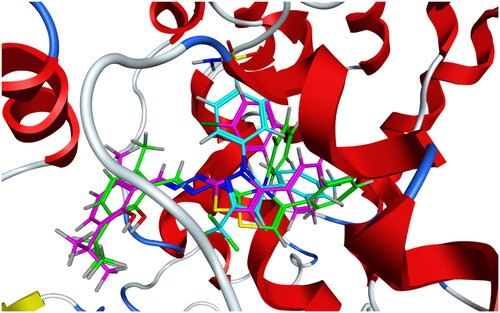
Table 2. Induced fit docking results of the active compounds inside COX-2 active site.
Figure 9. Mode of binding of NDGA inside 5-LOX active site 2D (left) and 3D (right).
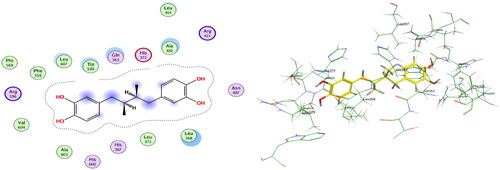
Figure 10. Overlay of NDGA (cyan) and docked NDGA (yellow) inside 5-LOX active site with RMSD = 1.2.
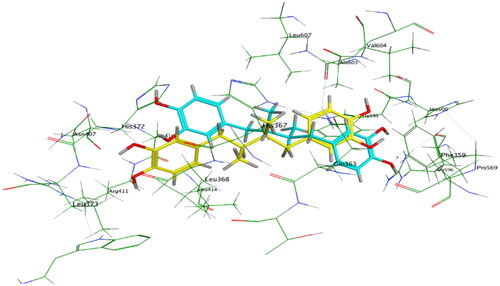
Figure 11. Mode of binding of 6b inside 5-LOX active site 2D (left) and 3D (right).
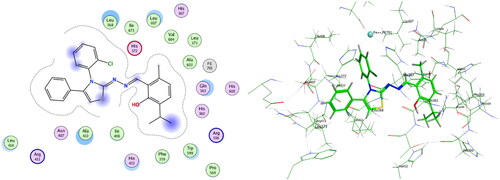
Figure 12. Mode of binding of 6f inside 5-LOX active site 2D (left) and 3D (right).
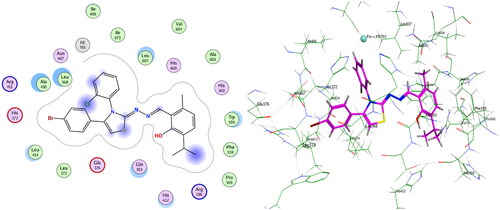
Table 3. Induced fit docking results of the active compounds in 5-LOX active site.
Figure 14. RMSD of COX-2 apo (Grey), 6b (Blue), and 6f (red) complex structures.
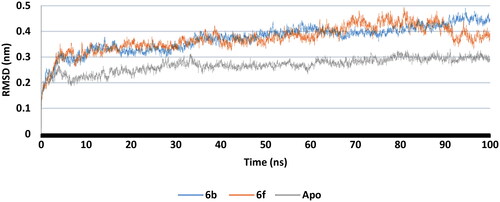
Figure 13. Overlay of docked NDGA (yellow), 6b (green), and 6f (magenta) inside 5-LOX active site.
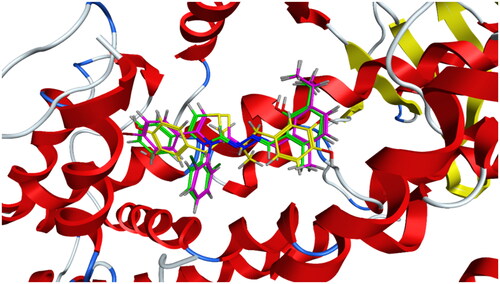
Figure 15. RMSF of COX-2 -ligand interaction residues, Apo (Grey), 6b (Blue), and 6f (red): (A) Part I and II and (B) Part III.
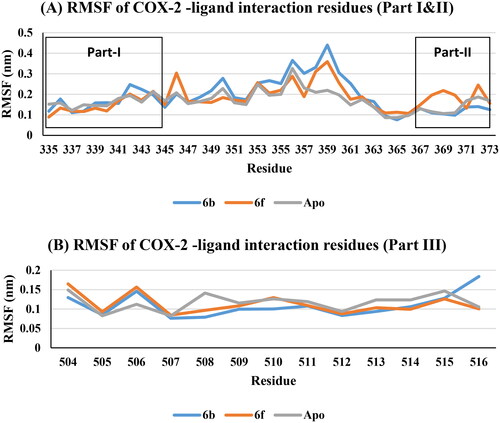
Figure 16. Rg plot of Apo (Grey), 6b (Blue), and 6f (red).
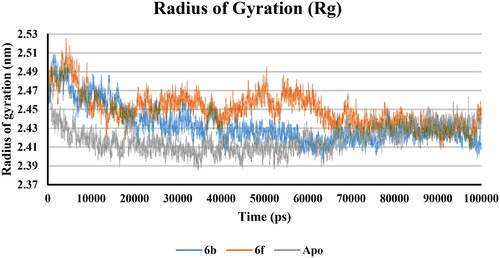
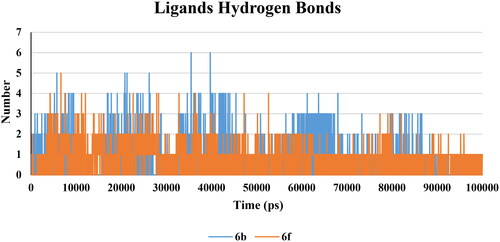
Figure 17. Hydrogen bonds between 6b (Blue) and 6f (red) ligands and protein.
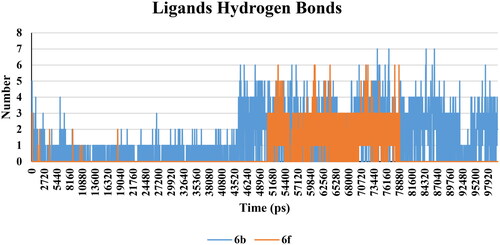
Figure 18. RMSD of 5-LOX apo (Grey), 6b (Blue), and 6f (red) complex structures.
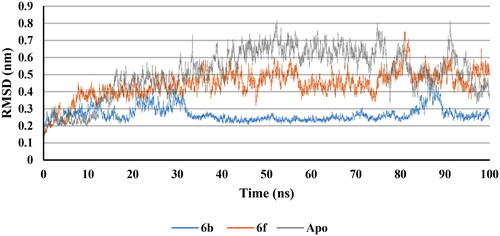
Figure 19. RMSF of 5-LOX -ligand interaction residues, Apo (Grey), 6b (Blue), and 6f (red): (A) Part I and II and (B) Part III.
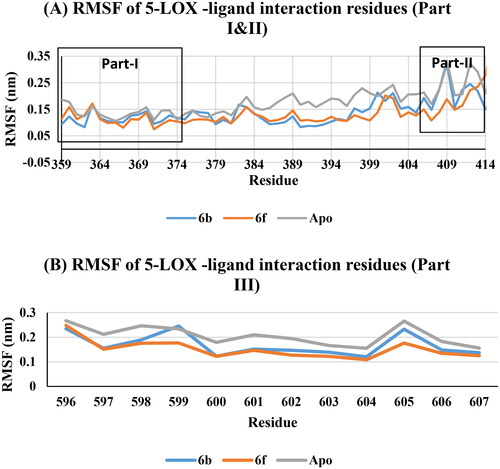
Figure 20. Rg plot of Apo (Grey), 6b (Blue), and 6f (red) complexes.
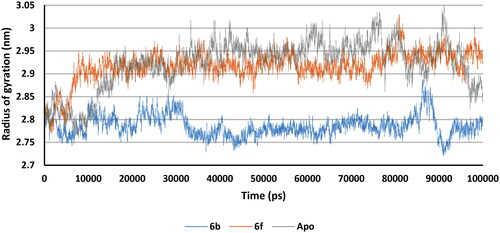
Figure 21. Hydrogen bonds between 6b (Blue) and 6f (red) ligands and protein.