Figures & data
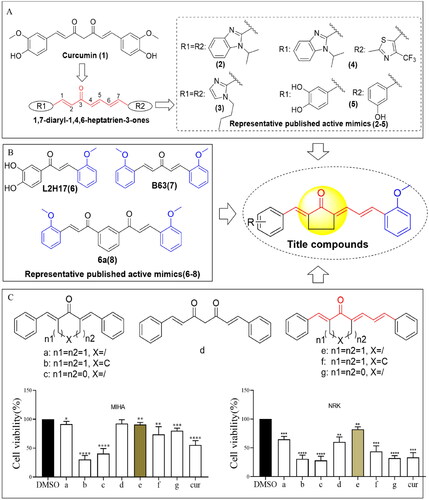
Figure 1. Design of 1,7-diphenylhepta-1,4,6-trien-3-one analogs comprising an o-methoxy phenyl group as anticancer agents. (A) Structure of curcumin and MCAs with anticancer activity featuring the 1,4,6-trien-3-one moiety. (B) Compounds exhibiting anticancer activity containing an o-methoxy phenyl ring. (C) Cytotoxicity of curcumin (cur) and its analog scaffold at 20 µM against MIHA and NRK cells. *p < 0.05, **p < 0.01, ***p < 0.001, ****p < 0.0001 vs. the DMSO group.
Scheme 1. The general route for asymmetric synthesis
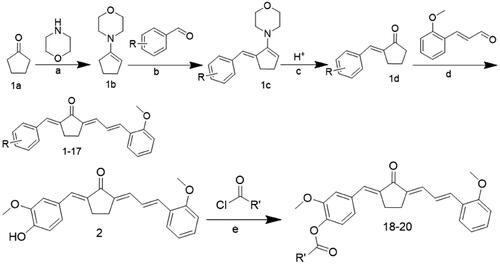
Table 1. Chemical structures of compounds 1–17.
Table 2. Chemical structures of compounds 18–20.
Figure 2. Anti-viability activities and quantitative structure–activity relationship (QSAR) analysis of 1,7-diphenyl hepta-1,4,6-trien-3-one analogs containing an o-methoxy phenyl group. Compounds inhibited the growth of cancer cells SGC-7901 (A) and BGC-823 (B). Cancer cells were treated with compounds (10 μM) for 72 h. The optical density values were measured using the MTT assay, and the resulting inhibitory rates were calculated. The QSAR model and the top 10 important features of compounds active against SGC-7901 (C and E) and BGC-823 (D and F) cells.
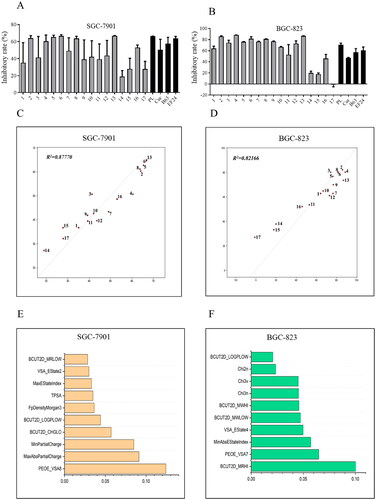
Table 3. The half inhibitory concentration (IC50, µM) of tested compounds against SGC-7901 and BGC-823 cancer cell lines.
Figure 3. Compound 2 inhibits the proliferation and migration of SGC-7901 cancer cells. (A) The SGC-7901 cells treated with different concentrations of compound 2 (2.5, 5, and 10 µM) and curcumin (cur) (5 and 10 µM). Following a 12-h treatment period, the medium was replaced with a normal medium, and the cells were incubated until visible colonies formed. Finally, the colonies were stained with crystal violet staining solution and photographed. (B) The effect of compound 2 on the migration of SGC-7901 cells. The images were captured using phase contrast microscopy before (0 h) and after 48 h of treatment with different concentrations of compound 2 (2.5, 5, and 10 µM) and cur (5 and 10 µM). (*p < 0.05, **p < 0.01, ***p < 0.001, ****p < 0.0001 vs. DMSO group; #p < 0.05, ##p < 0.01, ###p < 0.001).
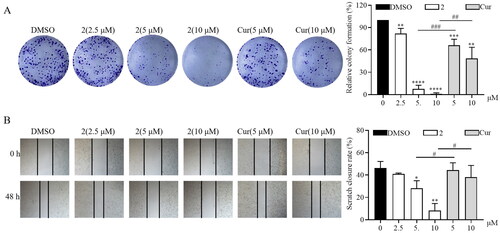
Figure 4. Impact of compound 2 on apoptosis and cell cycle arrest in SGC-7901 cancer cells. (A) Apoptosis in SGC-7901 cells was assessed following an 18-h treatment with compound 2 at different concentrations (2.5, 5, and 10 µM). Cells were stained with annexin V- fluorescein isothiocyanate and propidium iodide and quantified using a flow cytometer. (B) SGC-7901 cells were incubated with compound 2 (2.5, 5, and 10 µM) for 18 h. Subsequently, they were fixed and stained, and DNA content was assessed. The distribution and percentage of cells in the G1/G0, S, and G2 phases of the cell cycle are indicated.
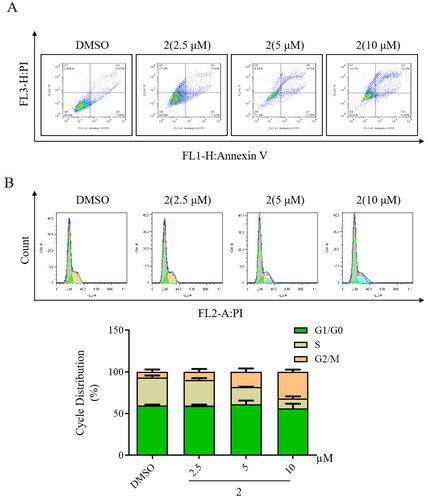
Figure 5. Effects of compound 2 on STAT3/AKT signalling pathway in SGC-7901 cancer cells. The protein expression levels of p-STAT3, STAT3 (A) and p-AKT, AKT (B) in SGC-7901 cell lines after treatment with compound 2 (2.5, 5, and 10 µM) and curcumin (10 µM). *p < 0.05, **p < 0.01, ****p < 0.0001 vs. the control group. ##p < 0.01, ###p < 0.001 vs. compound 2 (10 µM)-treated group.
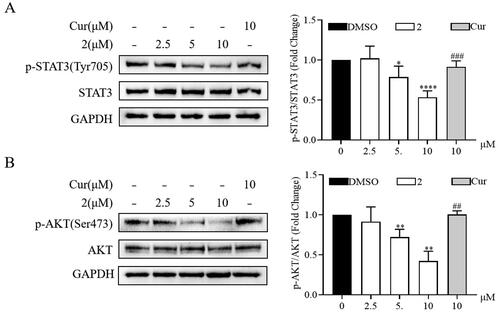
Figure 6. Compound 2 reduced tumour growth in the SGC-7901 mouse xenograft model. (A) Gross morphology of tumours excised from each group of mice 20 days after treatment. (B) Tumour volume assessment illustrating the inhibitory effect of compound 2 (15 mg/kg) on tumour growth compared to curcumin (cur) (20 mg/kg) or vehicle (control). (C) The average weights of xenograft tumours at the end of treatment. (D) Body weight changes observed during the 20-day dosing period. (E–F) The protein expression levels of p-STAT3, STAT3, p-AKT, and AKT in tumour tissues. *p < 0.05, **p < 0.01, ***p < 0.001, ****p < 0.0001.
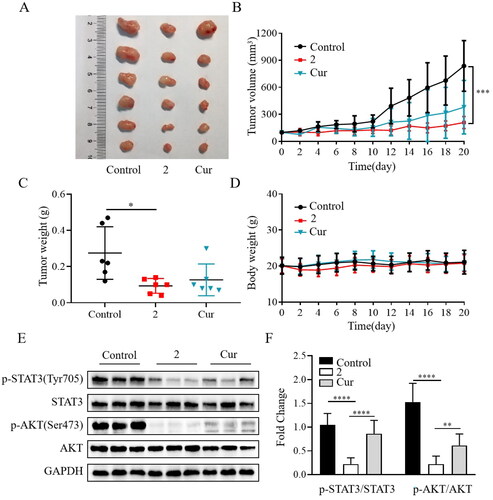
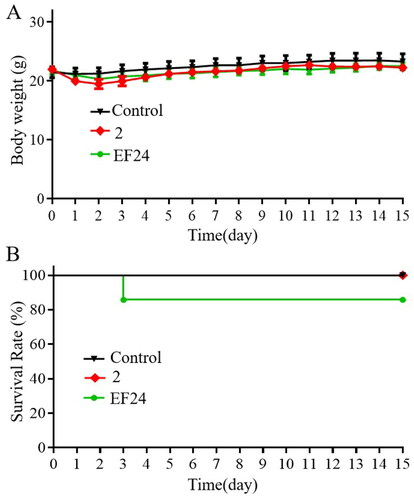
Figure 7. Compound 2 possesses a favourable in vivo safety profile. Compound 2 and EF24 (600 mg/kg) were administered to the mice on day 1 (A) Variation of body weight, and (B) mortality rate throughout the 15-day observation period.