Figures & data
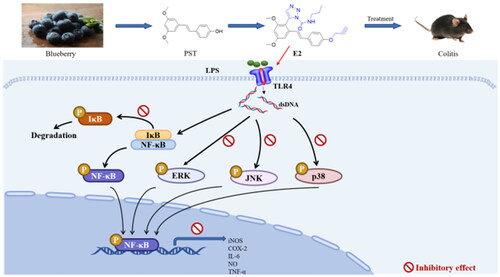
Figure 1. Design of the title compounds to achieve potential anti-inflammatory activity.
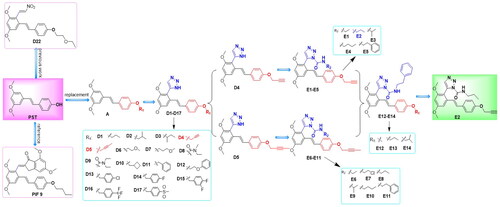
Scheme 1. Synthesis of compounds D1-D17 and E1-E11. Reagents and conditions: (i) C2H3N, K2CO3, 60 °C, 15 h, R1; (ii) C2H3N, DMF, POCl3; (iii) CH3NO2, CH3COONH4, 100 °C; (iv) DMF, NaN3, P-TSOH, 60 °C; (v)DCM, R2, DMF, (CH3CH2)3N, 2 h.
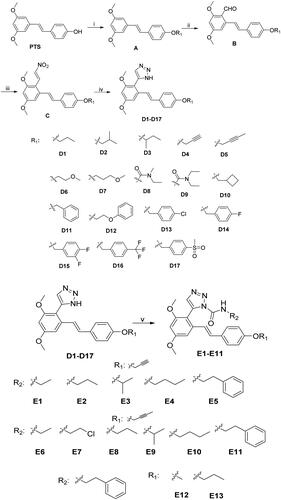
Figure 2. Single crystal structures of compound D11.
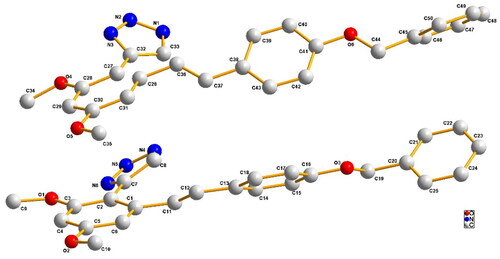
Figure 3. The cytotoxicity of the pterostilbene derivatives was tested by MTT assay. RAW264.7 cells were pre-incubated with compound (20 μM) for 24 h and then were detected by MTT assay. All data are expressed as mean ± standard deviation.
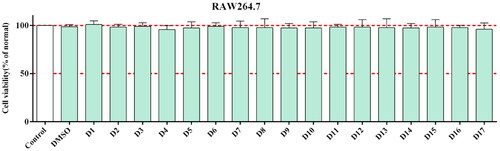
Figure 4. Inhibitory effects of the synthetic compounds (D1-D17) on LPS-induced NO production. ***P < 0.001 Compared with LPS treated group. Cel: celecoxib; as a positive control.
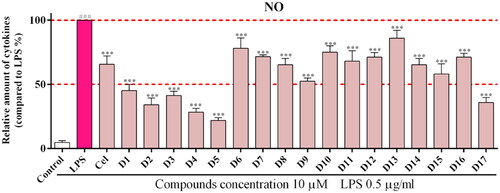
Table 1. Compounds E1-E13 inhibitory activity against NO release.
Figure 5. Inhibition of inflammatory protein expression by compound E2. RAW264.7 was pre-treatment with compounds (2 µM, 1 µM, 0.5 µM) for 1 h, and then exposed to LPS (500 ng/mL) for 24 h. Bay11-7082 (1 µM) is an NF-κB signalling pathway inhibitor. *** P < 0.001 compared with LPS treated group.
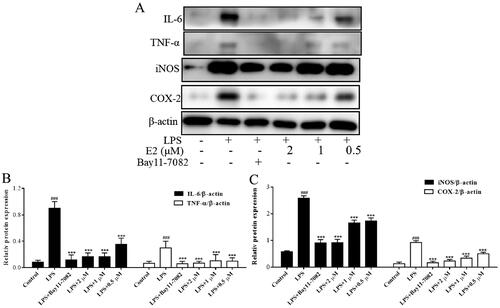
Figure 6. Inhibition of NF-κB inflammatory signalling pathway by compound 8. RAW264.7 was pre-treatment with compound 8 (2 µM, 1 µM, 0.5 µM) for 1 h, and then exposed to LPS (500 ng/mL) for 30 min. Bay11-7082 (1 µM) is an NF-κB signalling pathway inhibitor. *** P < 0.001 compared with LPS treated group.
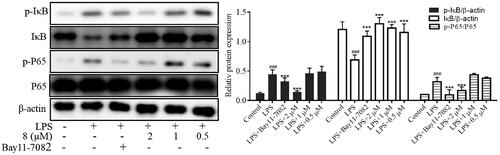
Figure 7. Inhibition of MAPKs inflammatory signalling pathway by compound E2. RAW264.7 was pre-treatment with compound E2 (2 µM, 1 µM, 0.5 µM) for 1 h, and then exposed to LPS (500 ng/mL) for 30 min. *** P < 0.001 compared with LPS treated group.
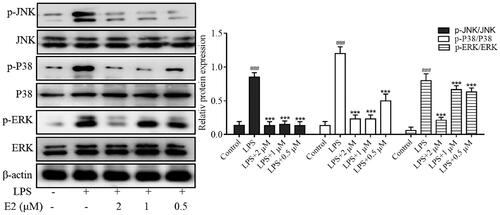
Figure 8. Compound E2 alleviates DSS-induced colitis in mice. (a) Mice show bloody stools (b) Weight change; (c) DAI was calculated; (d, e) Measuring the length of the colon; (f) Histopathological analysis of mouse colon. Data are represented as mean and SEM. Sulfasalazine (SASP) was used as a positive control drug. Compared with the Normal group, ### P < 0.001; Compared with DSS treated group, *** P < 0.001.
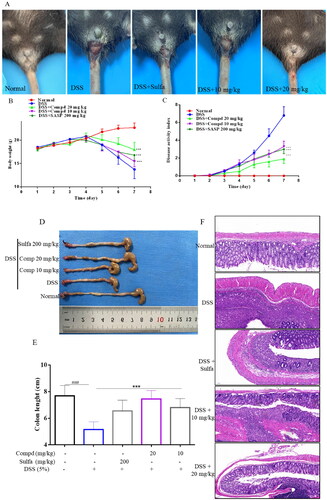
Figure 9. Compound E2 inhibits pro-inflammatory factor expression and MPO levels. (a) Detection of MPO activity in colon tissue. (b − d) ELISA determined the cytokine levels of TNF-α, IL-1β, and IL-6. Values are expressed as a mean ± SEM. ### P < 0.001 compared with the Normal group; *** P < 0.001 Compared with DSS treated group.
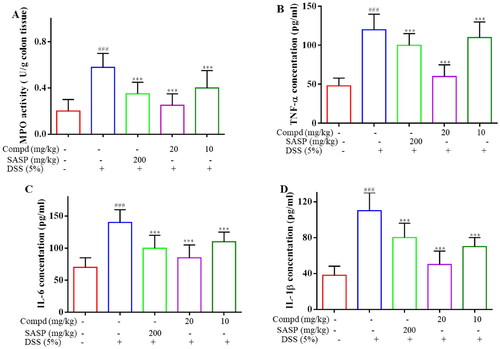
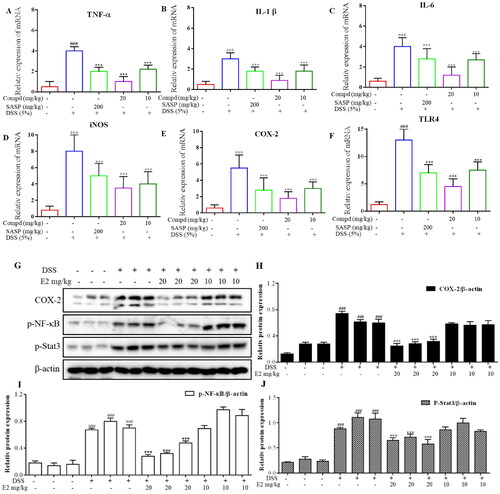
Figure 10. Compound E2 treatment downregulated the Inflammatory proteins and signalling pathway in acute DSS-induced colitis. (A-F) TNF-α, IL-1β, IL-6, iNOS, COX-2 and TLR4 mRNA levels in colon tissues. (G-J) Representative Western blot images of colonic COX-2, p-NF-κB, p-Stat3, and β-actin proteins. Compared with Normal group, ### P < 0.001; Compared with DSS treated group, *** P < 0.001.