
Figures & data
Figure 1. Subdivision of MAGL catalytic site (PDB code: 3PE6) into 5 different grids.
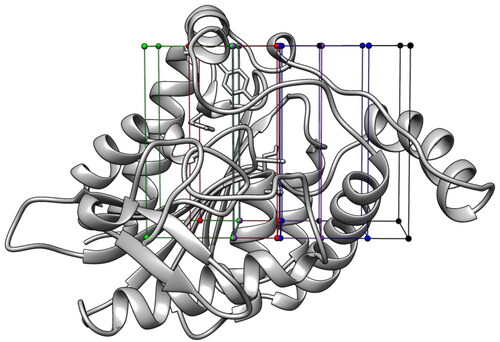
Figure 2. Population density of the clusters selected for the analysis.
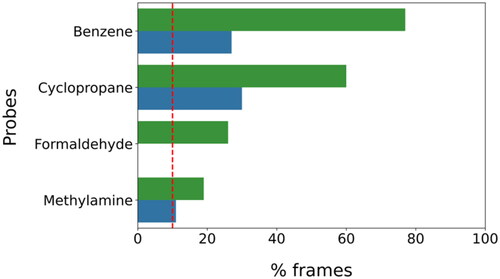
Figure 3. The most populated clusters identified for each probe fragment studied are shown in orange: two for benzene, cyclopropane, and methylamine and one for formaldehyde. The protein residues surrounding the ligands are shown in gray. Probes-protein hydrogen bonds are highlighted with black dashed lines.
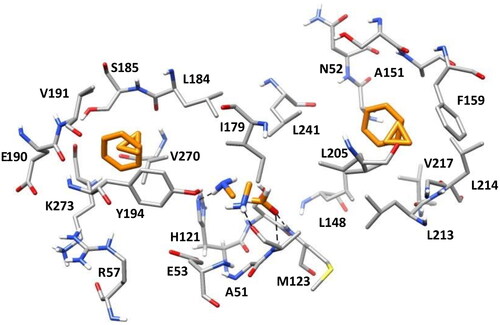
Figure 4. Receptor-based pharmacophore model derived from the most relevant fragment-probe interactions observed.
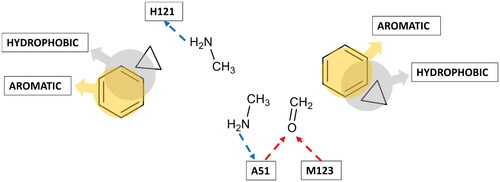
Table 1. Pharmacophore screening results.
Table 2. Consensus docking results.
Table 3. In vitro inhibitory activity on MAGL (IC50, µM) of compounds VS1 − 7 and the reference compound 6.
Figure 5. Analysis of the mechanism of MAGL inhibition of compounds VS2 and VS5. (A) Effect of DTT on MAGL inhibition activity. (B) IC50 (nM) values at different preincubation times with MAGL (0 min, 30 min and 60 min).
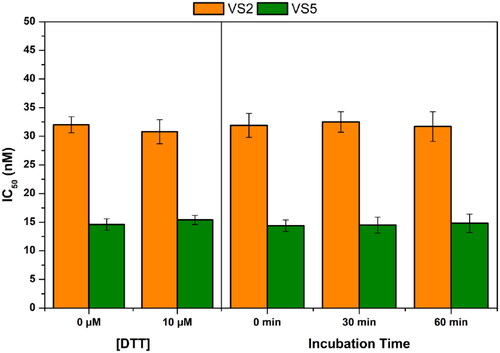
Figure 6. Minimised average structure of compound VS2 (A) and VS5 (B) within MAGL catalytic site. The protein residues surrounding the ligands are shown. Ligand-protein hydrogen bonds are highlighted with black dashed lines.
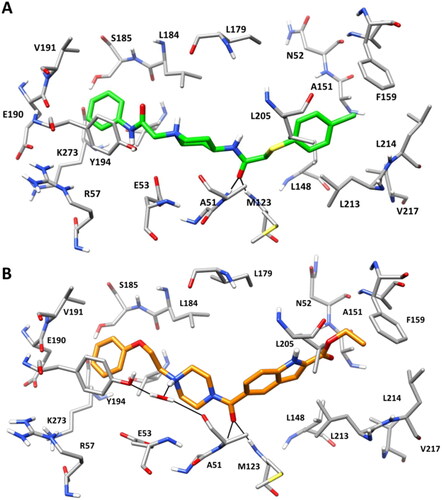
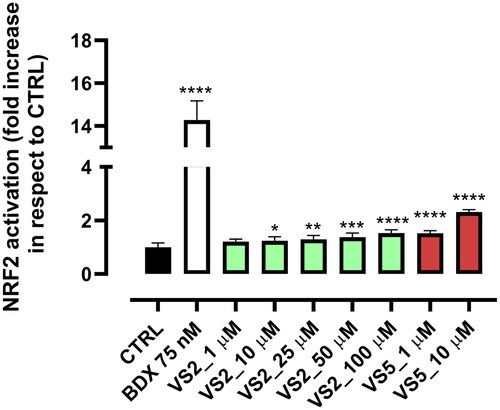
Figure 7. Dose-dependent effect of compounds VS2 and VS5 on NRF2 nuclear translocation. Statistical analysis was calculated by one-way ANOVA with Bonferroni’s multiple comparison test (*p < 0.05, **p < 0.01, ***p < 0.001, ****p < 0.0001).
Supplemental Material
Download PDF (769.2 KB)Data availability statement
The data that support the findings of this study are available from the corresponding author, [TT], upon reasonable request.