Figures & data
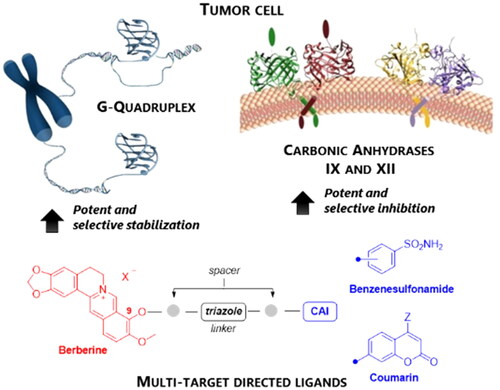
Figure 1. Rationale for the development of GQ ligand–CAI derivatives as innovative chemotherapeutics to disrupt tumour cell growth at multiple levels.
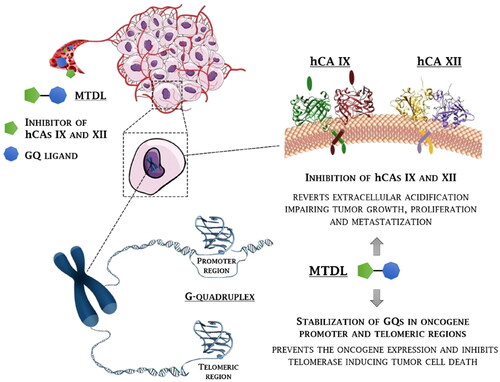
Figure 2. Chemical structure of the carbonic anhydrase inhibitors discussed here.
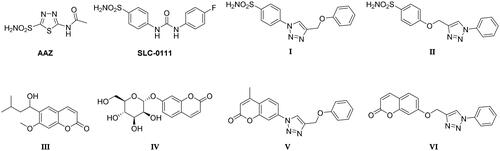
Figure 3. Drug design and general structure of the berberine-CAI derivatives proposed here.
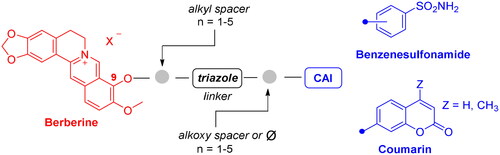
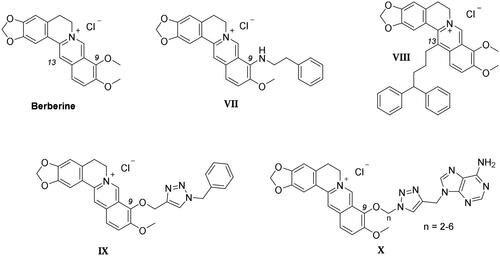
Figure 4. Chemical structure of the berberine derivatives as GQ ligands discussed here.
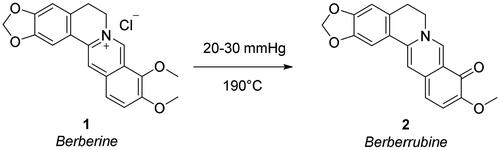
Scheme 1. Synthetic path to yield berberrubine 2 from berberine hydrochloride 1.
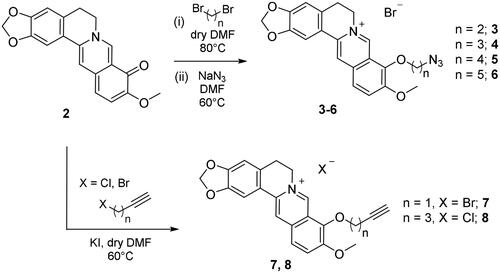
Scheme 2. Synthetic pathway to yield the berberine azide (3–6) and alkyne (7, 8) intermediates.
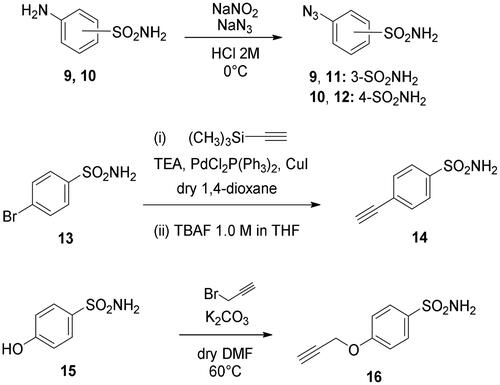
Scheme 3. Synthesis of benzenesulfonamide azide (11, 12) and alkyne (14, 16) intermediates.
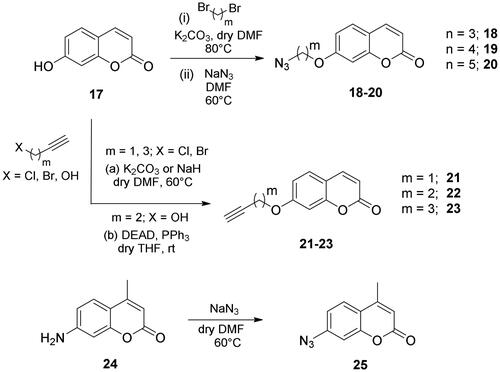
Scheme 4. Synthesis of coumarin azide (18–20 and 25) and alkyne (21–23) derivatives.
Scheme 5. Synthesis of derivatives 26–39 of type 1 which include the triazole N1 berberine oriented. CuAAC: (i) CuSO4 and sodium ascorbate or (ii) Cu nanosized and tetramethylammonium chloride in tBuOH/H2O at 40 °C.
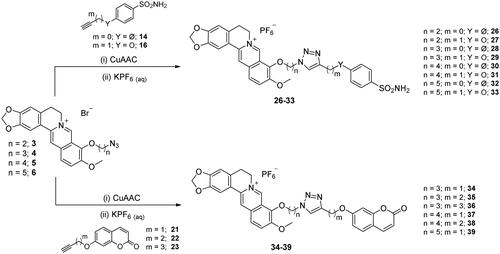
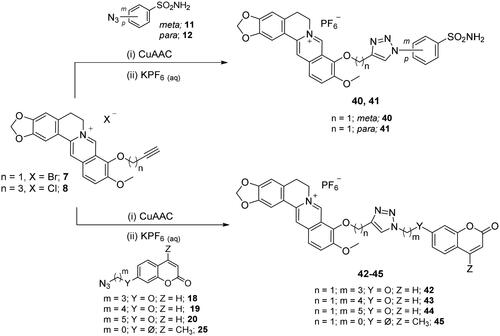
Scheme 6. Synthesis of hybrid derivatives 40–45 of type 2 which include the triazole N1 CAI oriented. CuAAC: (i) CuSO4 and sodium ascorbate or Cu nanosized and tetramethylammonium chloride in tBuOH/H2O at 40 °C.
Scheme 7. Synthesis of berberine derivative 49 bearing an aliphatic primary sulphonamide moiety.
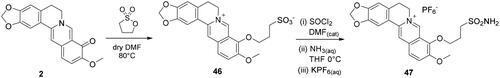
Table 1. Inhibition data of human CA I, II, IX, and XII isoforms with sulphonamides 26–33, 40, 41, 47 and coumarins 34–39, 42–45 derivatives and the standard sulphonamide inhibitor acetazolamide (AAZ) by a stopped-flow CO2 hydrase assayCitation49.
Table 2. Changes in the G4-stabilising effect (ΔΔT1/2) of the indicated compounds with respect to berberine, as determined by circular dichroism melting experiments.
Table 3. Compound-induced thermal stabilisation of the dual-labelled F-c-Kit1-T GQ measured by FRET melting competition experiments.
Figure 5. (A) Monomolecular parallel GQs arranged in columns growing along the c axis. (B) OMIT electron density map contoured at 2σ level of S-3,2 (29) and skeleton of the ligand in the two disordered orientations—gray (Y orientation) and black (Z orientation); (C) and (D) interaction detail with GQ: (C) Y orientation; (D) Z orientation (T11 and T12 nucleic base atoms not shown). Final coordinates and structure factors (Table S3, Supporting Information) have been deposited with the Protein Data Bank (PDB accession number 7PNL).
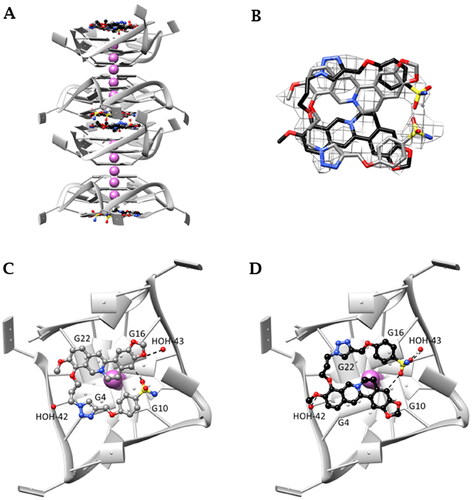
Table 4. Concentrations of the investigated MTDLs required to give 50% of cell viability reduction (IC50 values), by means of the MTT assay.
Figure 6. (A) Representative fields showing G4 foci formation detected by immunofluorescence in HeLa cells treated for 24 h with 35.0 µM S-4,0, 40.0 µM C-4,2, and 37.5 µM C-5,2 or an equivalent amount of vehicle (0.1% DMSO). As a positive control, cells were treated with 2 µM RHPS4 (a well-established GQ ligand)Citation68 for 24 h. Scale bar: 10 µm. Upper panels: the merged channels of BG4-stained GQ structures (magenta) and Hoechst-counterstained nuclei (grey) are reported. Lower panels: enlargements from the pictures in the upper panels. (B) Quantitative analysis of the fluorescence intensity of the total number of GQ foci. An average of 50 cells were screened for each condition and the results are expressed as a fold change of fluorescence intensity (anti-GQ signal) over the negative control (DMSO). Histograms show the mean ± SD of three independent experiments. The statistical significance was calculated using a one-way ANOVA test on GraphPad Prism 8.0.2 (ns: not significant, **: p < 0.01).
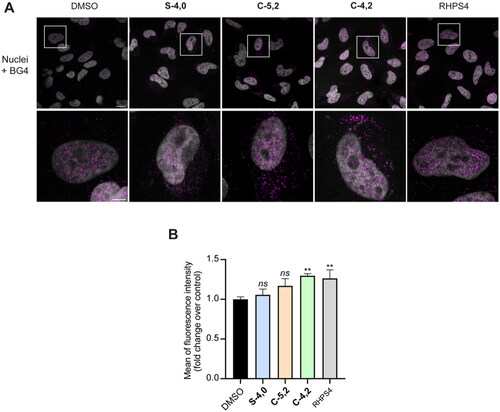
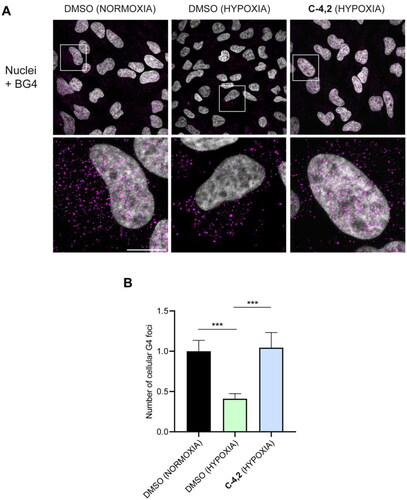
Figure 7. (A) Representative fields showing G4 foci formation detected by immunofluorescence in HeLa cells pre-treated with 50 μM cobalt (II) chloride hexahydrate for 60 h to induce hypoxia and then exposed to 1 µM C-4,2 or vehicle (0.1% DMSO) for the following 12 h, still in the presence of CoCl2. DMSO-treated normoxic HeLa cells are also shown. Scale bar: 10 µm. Upper panels: the merged channels of BG4-stained GQ structures (magenta) and Hoechst-counterstained nuclei (grey) are reported. Lower panels: enlargements from the pictures in the upper panels. (B) Quantification of the cellular BG4 foci in DMSO-treated normoxic HeLa cells, DMSO-treated hypoxic HeLa cells, and C-4,2-treated hypoxic HeLa cells. An average of 50 cells were screened for each condition. The number of GQ foci has been normalised to the mean of the corresponding control sample (DMSO). Histograms show the mean ± SD of three independent experiments. The statistical significance was calculated using a one-way ANOVA test on GraphPad Prism 8.0.2 (**: p < 0.01, ****: p < 0.0001).