
Figures & data
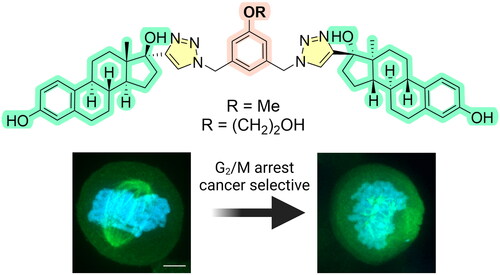
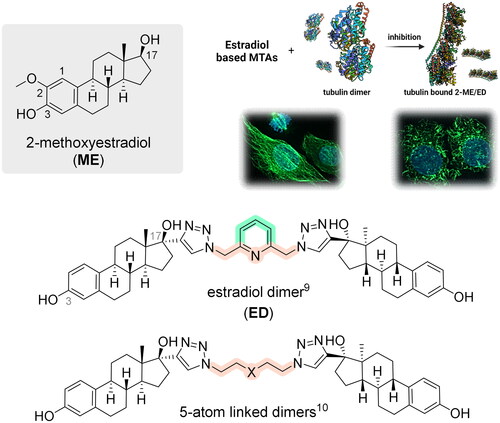
Figure 1. Chemical structure of estradiol-based antimitotics and proposed mechanism of action. Created with Biorender.com.
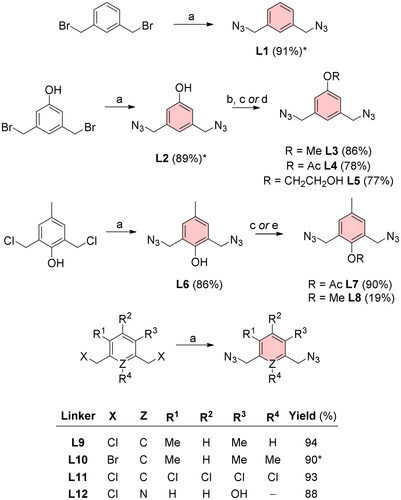
Scheme 1. Diazide linkers for CuAAC reaction with EE. Reagents and conditions: (a) NaN3, DMF, heated, ON; (b) MeI, NaH, DMF, 0 °C, 4 h; (c) 4-DMAP, Ac2O, DCM, RT, ON; (d) acetone, 2-bromoethanol, K2CO3, 60 °C, ON; (e) MeI, DMF, toluene, NaH, 0 °C, 1 h. *Reaction yields for L1 and L10 reported by Thomas et al.Citation12 were 96%. The yield of L2 by Rasheed et al.Citation13 was 95%.
Scheme 2. Structures of estradiol dimers prepared by 1,3-dipolar cycloaddition. CuAAC: CuSO4·5H2O (10 mol%), sodium ascorbate (15 mol%), DMF, MW, 80 °C, 2 h.
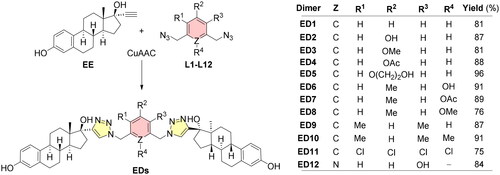
Table 1. Summary of cytotoxic activities (IC50, µM).Table Footnotea
Figure 2. Effect of cytotoxic compounds on cell cycle (A), mitosis (B), sub-G1 fraction (C), induction of polyploidy (D), and DNA/RNA synthesis (E, F) as assessed by flow cytometry in CCRF-CEM lymphoblasts (% of positive cells). Experiments were conducted at concentrations corresponding to 1 × IC50 and 5 × IC50 values. DNA fragmentation was assessed using a logarithmic model expressing the percentage of particles with propidium iodide content lower than cells in the cell cycle’s G0/G1 phase (<G1). Detailed numerical values can be found in the Supplementary Material Table S1.
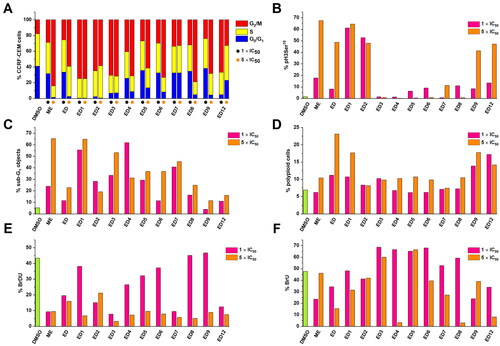
Figure 3. Estradiol dimers inhibit tubulin polymerisation in vitro (A). Tubulin assembly was measured using compounds at a concentration of 10 μmol/L, or an equivalent volume of DMSO. Inhibition of polymerisation velocity relative to DMSO control reaction measured at a concentration of 10 μmol/L. Data are represented as mean values with standard deviation (SD) calculated from three independent experiments (B).
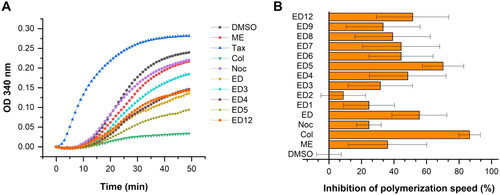
Table 2. Inhibition of tubulin assembly in comparison to colchicine as reference compound.
Figure 4. Estradiol dimers inhibit the formation of mitotic spindle. Immunofluorescent imaging of U2OS labelled with α-tubulin – Alexa Fluor-488 antibody (green fluorescence) following a 24-h incubation with DMSO (control), ED (comparative control), ED3, ED5 (all dimers concentrations were set to 10 µM), and colchicine (1 µM). Condensed chromosomes were visualised using Hoechst 33342 (blue fluorescence). Scale bar 2 µm.
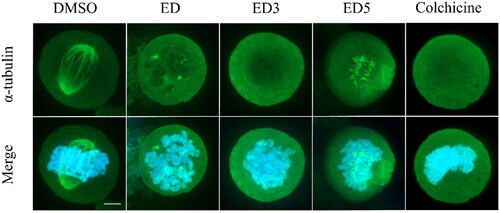
Figure 5. Estradiol dimers inhibit the endothelial cell tube formation angiogenesis. Figure illustrates the network formation of HUVEC primary endothelial cells in the presence of DMSO (control), 60 nM suramine, 60 nM colchicine or 5 × IC50 concentration of ED, ED3 and ED5. The cells and nuclei were visualised using DIC and Hoechst 33342 (blue fluorescence) or calcein (green fluorescence). Scale bar: 200 µm.
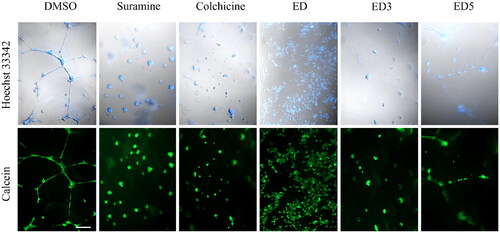
Figure 6. Docking poses of compounds ED3 (magenta) and ED5 (yellow) within the tubulin structure 4O2B (α chain is green, β – orange).
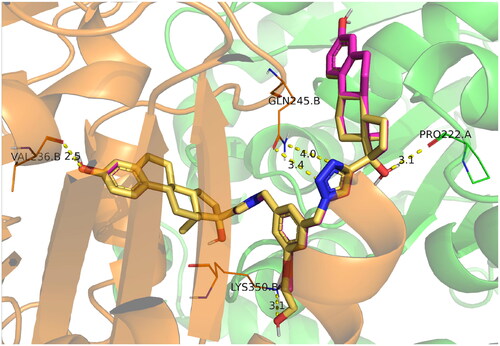
Figure 7. Calculated protein–ligand contacts were identified in at least 10% of MD trajectories for ED (panel A), ED3 (panel B), and ED5 (panel C). Contacts were analysed exclusively for the stable part of trajectories, 50–150 ns.
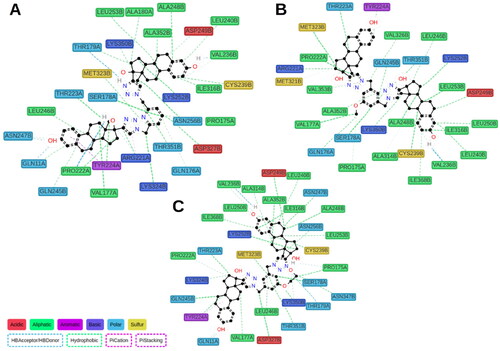
Figure 8. Molecular structures of previously reported estradiol dimers (panel A) and correlation plot between calculated binding free energies and tubulin polymerisation speed (panel B). The shaded region depicts the confidence interval at 0.95 significance level.
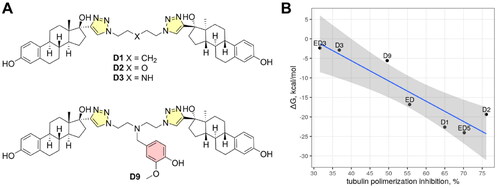
Table 3. Binding free energies of estradiol dimers from this (ED, ED3, ED5) and the previous study (D1, D2, D3, D9)Citation10 were calculated by MM-PBSA.
Supplemental Material
Download PDF (2.6 MB)Data availability statement
The datasets presented in this study are available from the corresponding author upon reasonable request.