Figures & data
Table 1. Influenza A vaccines administered by season and year of matriculation at Christ’s Hospital Boarding School. Influenza A (H3N2) outbreaks occurred in December 1972, spring 1974, and spring 1976.
Figure 1. Influenza A attack rates and vaccination status at a British boarding school during the 1976 outbreak. The analysis was restricted to students attending school during all three outbreaks. We estimated the attack rates for boys not previously infected (light gray bars) by recalculating the denominators after excluding ‘Cases 1972: A/England’ and ‘Cases 1974: A/Port Chalmers’ as shown in the original publication. The A/Port Chalmers/1/73 vaccine (‘A/PC’) was co-administered with A/England/42/72 for the 1974–75 season, and with A/Scotland/840/74 for the 1975–76 season. Data for this figure were derived from of reference [Citation8] and reprinted from The Lancet, Vol 313/Issue 8106, T.W. Hoskins, Joan R. Davies, A.J. Smith, Christine L. Miller, Audrey Allchin, Assessment of inactivated influenza-a vaccine after three outbreaks of influenza a at christ’s hospital/p33-35, 1979, with permission from Elsevier.
![Figure 1. Influenza A attack rates and vaccination status at a British boarding school during the 1976 outbreak. The analysis was restricted to students attending school during all three outbreaks. We estimated the attack rates for boys not previously infected (light gray bars) by recalculating the denominators after excluding ‘Cases 1972: A/England’ and ‘Cases 1974: A/Port Chalmers’ as shown in the original publication. The A/Port Chalmers/1/73 vaccine (‘A/PC’) was co-administered with A/England/42/72 for the 1974–75 season, and with A/Scotland/840/74 for the 1975–76 season. Data for this figure were derived from Figure 2 of reference [Citation8] and reprinted from The Lancet, Vol 313/Issue 8106, T.W. Hoskins, Joan R. Davies, A.J. Smith, Christine L. Miller, Audrey Allchin, Assessment of inactivated influenza-a vaccine after three outbreaks of influenza a at christ’s hospital/p33-35, 1979, with permission from Elsevier.](/cms/asset/7cb8e8c5-4c18-4d17-a2ae-0afc0ce35e25/ierv_a_1334554_f0001_b.gif)
Figure 2. Allocation into placebo and intervention arms for five year clinical trial of repeated vaccination (from reference [Citation9]); TIV = trivalent inactivated whole virus vaccine.
![Figure 2. Allocation into placebo and intervention arms for five year clinical trial of repeated vaccination (from reference [Citation9]); TIV = trivalent inactivated whole virus vaccine.](/cms/asset/16bee036-82a1-45b1-954e-48e182270537/ierv_a_1334554_f0002_b.gif)
Figure 3. H3N2 virus shedding in 1984–85 and 1987–88 by total number of vaccine doses received in randomized clinical trial. Adapted from of reference [Citation9] and reprinted from Vaccine, Vol 15/Issue 10, Wendy A. Keitel, Thomas R. Cate, Robert B. Couch, Linda L. Huggins, Kenneth R. Hess, Efficacy of repeated annual immunization with inactivated influenza virus vaccines over a five year period, p 1114–22, 1997, with permission from Elsevier.
![Figure 3. H3N2 virus shedding in 1984–85 and 1987–88 by total number of vaccine doses received in randomized clinical trial. Adapted from Figure 1 of reference [Citation9] and reprinted from Vaccine, Vol 15/Issue 10, Wendy A. Keitel, Thomas R. Cate, Robert B. Couch, Linda L. Huggins, Kenneth R. Hess, Efficacy of repeated annual immunization with inactivated influenza virus vaccines over a five year period, p 1114–22, 1997, with permission from Elsevier.](/cms/asset/608e5563-8d27-4f80-85ac-db86fdd8e4bd/ierv_a_1334554_f0003_b.gif)
Table 2. Characteristics of 17 published studies that met eligibility criteria for assessment of current and prior season vaccine effectiveness.
Figure 4. Flow chart for screening and selection of articles for inclusion in meta-analysis of repeated vaccination and vaccine effectiveness.
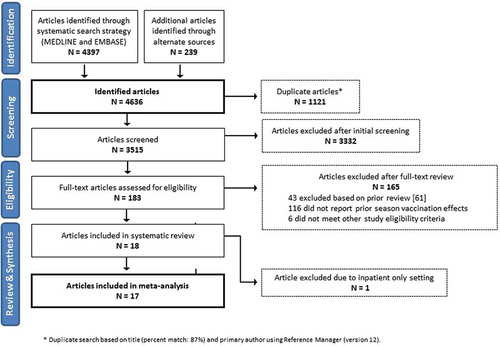
Figure 5. Vaccine effectiveness for H3N2 studies without age restriction. For each VE estimate, the comparison group included individuals who were unvaccinated in both the current and prior season.
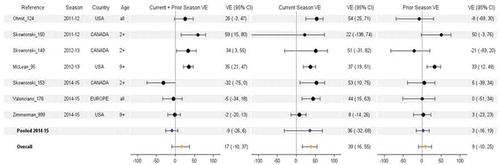
Table 3. WHO vaccine reference strains and corresponding egg-adapted high-growth reassortant viruses for vaccine production from 2009–2010 through 2014–2015.
Figure 6. Vaccine effectiveness for H1N1pdm09 studies without age restriction. For each VE estimate, the comparison group included individuals who were unvaccinated in both the current and prior season.
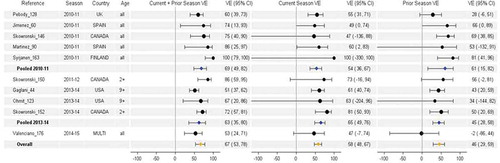
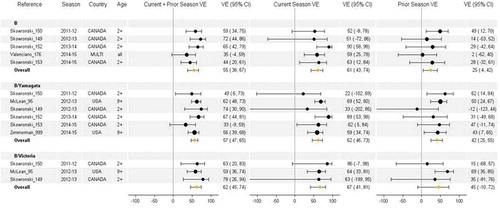
Figure 7. Vaccine effectiveness for type B (all), B/Yamagata, and B/Victoria studies without age restriction. For each VE estimate, the comparison group included individuals who were unvaccinated in both the current and prior season.