Figures & data
Figure 1. Distribution of seven endemic pools of FMD (reproduced from http://www.wrlfmd.org/).
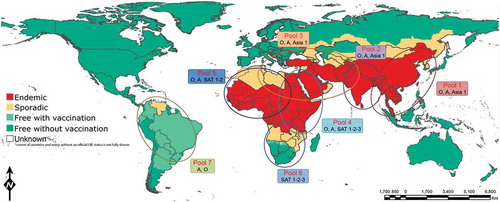
Figure 2. 3D structure (cartoon) of O1 BFS co-ordinates (1FOD, reduced) showing five neutralizing antigenic sites. VP1 is shown in red, VP2 in green, VP3 in blue and VP4 in cyan. The critical residues for the antigenic sites are shown as yellow spheres.
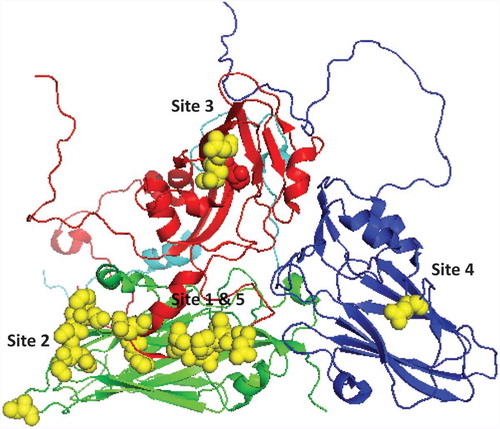
Figure 3. Heatmap and clustering analysis of VNT titers of 74 serotype O viruses with five antisera. Viruses are of global origin and clustered according to their neutralization profiles along the vertical axis. Similarly the antisera are arranged according to their abilities to neutralize the panel of viruses along the horizontal axis. A1: O/BFS, A2: O/Manisa, A3: O/Kaufbeuren, A4: O/UKG, A5: O/PanAsia-2. Darker color indicates higher VNT titer.
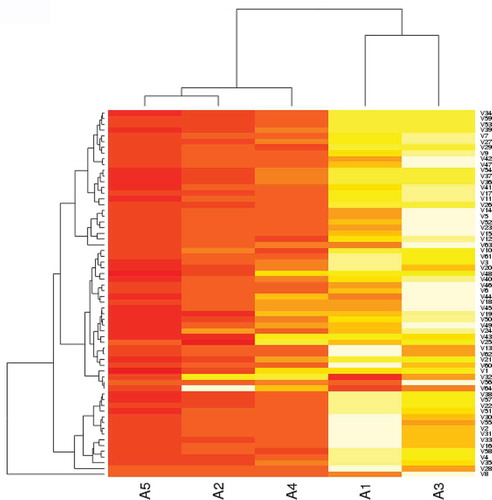
Table 1. FMD vaccines used in the East African countries.
Figure 4. Antigenic relationship (r1) values of 80 East Africa type O isolates. The serological match (r1-values) in the range of < 0.3, 0.3–0.5, and 0.5–1 for the six vaccine strains are shown.
Figure 5. Antigenic relationship (r1) values of serotype O Indian isolates (A) and isolates from other countries (B) against O/IND R2/75 vaccine antisera and (C) serotype O-Ind-2001d viruses against five post-vaccinal bovine antisera. The horizontal dotted line indicates the cut-off value of 0.3, above which the vaccine is considered to be a good match. Reproduced from (92) under Creative Commons Attribution License (CC BY).
Figure 6. Antigenic relationship (r1) values of 85 Southeast Asia type O isolates. The serological match (r1-values) in the range of < 0.3, 0.3–0.5 and 0.5–1 for the five vaccine strains are shown. Reproduced from (79) under Creative Commons Attribution License (CC BY).
Figure 7. (A) Bayesian phylogenetic tree of the A-Iran-05 viruses and (B) respective r1-values against A22/Iraq (white bars) and A/TUR/2006 (black bars) antisera. The sublineages were defined by WRLFMD on the basis of VP1 sequences and are labeled on the respective branches in this figure. The horizontal dotted line indicates the cut-off value of 0.3, above which the vaccine is considered to be a good match. Reproduced from (90) under Creative Commons Attribution License (CC BY).
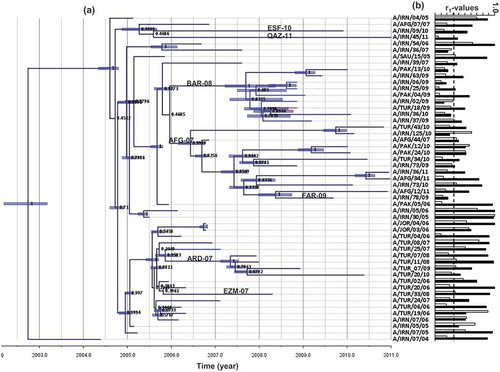
Figure 8. Antigenic relationship (r1) values of 56 East Africa type A isolates. The serological match (r1-values) in the range of < 0.3 and > 0.3 for the seven vaccine strains are shown.