
Figures & data
Table 1. Search strategy in Embase® and MEDLINE® using Embase.com platform.
Table 2. Summary of published studies on varicella in CEE.
Figure 1. Flow of studies through the review process.
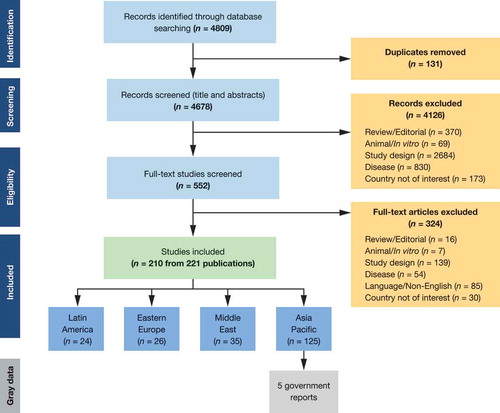
Figure 2. Seroprevalence (with 95% confidence intervals) of VZV IgG antibodies* in Croatian women of reproductive age [Citation21].
IgG, Immunoglobulin G; VZV, Varicella zoster virus.*By commercial enzyme-linked immunosorbent assay. n = positive for VZV IgG antibodies; N = total number tested.
![Figure 2. Seroprevalence (with 95% confidence intervals) of VZV IgG antibodies* in Croatian women of reproductive age [Citation21].IgG, Immunoglobulin G; VZV, Varicella zoster virus.*By commercial enzyme-linked immunosorbent assay. n = positive for VZV IgG antibodies; N = total number tested.](/cms/asset/3dca74ed-5e26-4588-839b-c53926cda31f/ierv_a_1573145_f0002_b.gif)
Figure 3. Incidence rate of varicella per 100,000 inhabitants in CEE (2000–2010) [Citation24].
CEE: Central and Eastern Europe.
![Figure 3. Incidence rate of varicella per 100,000 inhabitants in CEE (2000–2010) [Citation24].CEE: Central and Eastern Europe.](/cms/asset/e28664d1-6aa2-484c-9851-21b80df99faf/ierv_a_1573145_f0003_oc.jpg)
Figure 4. Seasonality of varicella in Croatia (1977–2012). Reproduced, with permission, from Vjekoslav Bakašun and Đana Pahor, ‘Epidemiological Patterns of Varicella in the Period of 1977 to 2012 in the Rijeka District, Croatia’, Epidemiology Research International, vol. 2014, Article ID 193,678 [Citation23].
![Figure 4. Seasonality of varicella in Croatia (1977–2012). Reproduced, with permission, from Vjekoslav Bakašun and Đana Pahor, ‘Epidemiological Patterns of Varicella in the Period of 1977 to 2012 in the Rijeka District, Croatia’, Epidemiology Research International, vol. 2014, Article ID 193,678 [Citation23].](/cms/asset/044258d6-2a14-49bb-bb1c-b5a24dd53ac6/ierv_a_1573145_f0004_b.gif)
Figure 5. Percentage of persons of all ages with varicella who were hospitalized across CEE (2008–2010) [Citation24].
![Figure 5. Percentage of persons of all ages with varicella who were hospitalized across CEE (2008–2010) [Citation24].](/cms/asset/17a3ea7e-7542-4220-a277-731858a5fe50/ierv_a_1573145_f0005_oc.jpg)
Table 3. Recommendations for varicella vaccination in different CEE populations.