Figures & data
Figure 1. The differences between the three methods of vaccine coverage estimation are illustrated. When an antigen is highly expressed on the bacterial strain and it is antigenically related to the vaccine antigen, the strain is predicted to be covered by MATS, gMATS, or MenDeVAR and killed in the bactericidal assay (Strain A). When an antigen is present at low amounts on the bacterial strain or is antigenically diverse to the vaccine ones, the strain is not predicted covered and the number of antibodies bound on bacterial surface are not sufficient to induce bactericidal killing (Strain B). However, when multiple antigens are present on a bacterial strain even if their diversity and expression levels are suboptimal and the strain is not considered covered by MATS, gMATS/MenDeVAR, the antibodies targeting multiple antigens can bind simultaneously and contribute synergistically to complement activation and bacterial killing (Strain C).
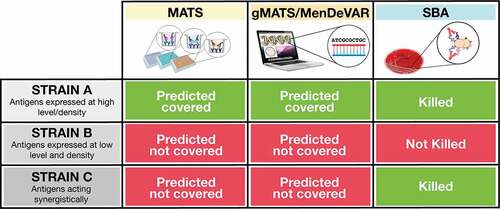
Figure 2. hSBA data of 4CMenB vaccinee sera on a panel of 7 MenB strains. Histograms show the percentage of participants achieving hSBA titer ≥4 after the final dose of rMenB (NadA, NHBA and fHbp – dark gray) or rMenB + OMV (light gray) vaccine.
Figure 3. hSBA titers obtained over a panel of 61 strains with pooled sera from infants vaccinated with different vaccine formulations. Infant sera were collected before and after the fourth vaccination dose and the sera were assayed as pool (25 subjects each group) in hSBA. Dots represent the SBA titer obtained for each of the 61 genetically different strains tested. Histograms show the geometric mean with 95% CI of SBA titers obtained using rMenB (cyan), rMenB + 6.25 µg OMV (light blue), rMenB + 25 µg OMV (dark blue) pooled antisera or the corresponding preimmune sera of each group (gray).
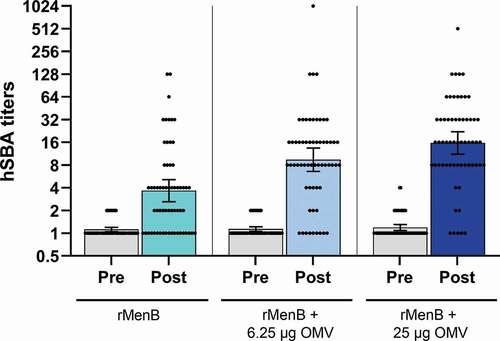
Figure 4. Serum bactericidal titers using human complement against indicator strains with or without the addition of the specific competitor. All sera tested derived from four subjects vaccinated with 4CMenB. 5/99, H44/76 and M4407 strains were selected to assess the contribution of antibodies directed against NadA, fHbp, and NHBA, respectively. The 5/99 strain overexpressing NHBA was a deletion mutant for nadA and NHBA complemented with the NHBA gene under the control of an IPTG-inducible promoter. Green dots denote significant inhibition (≥ fourfold) of SBA by the addition of exogenous antigens compared to the untreated sera (initial titer). Orange dots describe mild inhibitions characterized by a twofold decrease of SBA titers compared to the initial titer. Red dots indicate no inhibition at all. Figure generated based on data discussed in Giuliani et al. [Citation18].
![Figure 4. Serum bactericidal titers using human complement against indicator strains with or without the addition of the specific competitor. All sera tested derived from four subjects vaccinated with 4CMenB. 5/99, H44/76 and M4407 strains were selected to assess the contribution of antibodies directed against NadA, fHbp, and NHBA, respectively. The 5/99 strain overexpressing NHBA was a deletion mutant for nadA and NHBA complemented with the NHBA gene under the control of an IPTG-inducible promoter. Green dots denote significant inhibition (≥ fourfold) of SBA by the addition of exogenous antigens compared to the untreated sera (initial titer). Orange dots describe mild inhibitions characterized by a twofold decrease of SBA titers compared to the initial titer. Red dots indicate no inhibition at all. Figure generated based on data discussed in Giuliani et al. [Citation18].](/cms/asset/833f9f69-48cc-4ccb-9795-31dbd1c22efc/ierv_a_2050697_f0004_oc.jpg)
Figure 5. Strain-specific Breadth of Coverage obtained with the MenABCWY vaccine. Strain-specific BoC, calculated as (1 – relative risk) × 100 (relative risk = ratio between the percentage of samples seronegative at 1:4 dilution against the selected strains in the MenABCWY vs Control group), was determined for each of the 25 strains (not predicted to be covered by gMATS) out of 110 as measured by serum bactericidal activity. Figure realized from data described in Welsch et al. [Citation32].
![Figure 5. Strain-specific Breadth of Coverage obtained with the MenABCWY vaccine. Strain-specific BoC, calculated as (1 – relative risk) × 100 (relative risk = ratio between the percentage of samples seronegative at 1:4 dilution against the selected strains in the MenABCWY vs Control group), was determined for each of the 25 strains (not predicted to be covered by gMATS) out of 110 as measured by serum bactericidal activity. Figure realized from data described in Welsch et al. [Citation32].](/cms/asset/e5db418b-8480-43d2-81d8-92b92a3dec86/ierv_a_2050697_f0005_oc.jpg)
Figure 6. hSBA data on homologous and heterologous vaccine-strains. Histograms represent the percentage of responders in the SBA (≥fourfold rise) in all the three age-groups with various target strains, after three doses of VA-MENGOC-BC (A) or MenBVac (B). The vaccine homologous strain is represented by dotted histograms. The degree of strain-specific response varies with ages. Data represented in this figure are derived from [Citation4,Citation36].
![Figure 6. hSBA data on homologous and heterologous vaccine-strains. Histograms represent the percentage of responders in the SBA (≥fourfold rise) in all the three age-groups with various target strains, after three doses of VA-MENGOC-BC (A) or MenBVac (B). The vaccine homologous strain is represented by dotted histograms. The degree of strain-specific response varies with ages. Data represented in this figure are derived from [Citation4,Citation36].](/cms/asset/621013fd-b068-4eb9-8fc2-7856090366a5/ierv_a_2050697_f0006_b.gif)
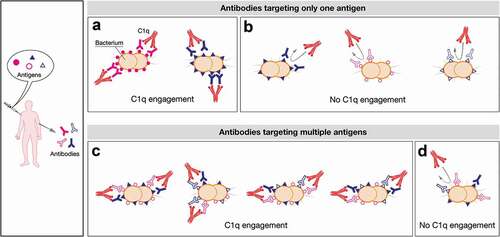
Figure 7. Schematic representation of the possible mechanisms of C1q engagement following vaccination with multicomponent vaccines. Upon vaccination with a multicomponent vaccine formulation a plethora of different antibodies are simultaneously elicited. They can differently trigger complement cascade relying on the antigen density profile and the expression levels of each strain. In the proposed model a defined density and/or a defined level of expression of each antigen are required to trigger the killing mediated by complement. Here, the threshold density/levels of expression is represented by five or six antigens per cell that can be both identical or dissimilar (A and C). On the contrary, the presence of three molecules per cell is schematically represented as not dense enough to recruit C1q (B and D). In particular, an antigen can be constitutively highly expressed in bacterial isolates leading to highly dense antigen–antibody complexes able to recruit C1q and to lead to bacterial lysis (e.g. filled pink circles, (A)). Generally, the amount and the distribution profile of an antigen can also change between isolates influencing the SBA outcome (e.g. filled blue triangle, A and B). Moreover some determinants may be expressed at very low levels on bacterial surface (eg strains expressing only open pink circles or open blue triangles (B) and strains simultaneously expressing different antigens but at low density/levels, (D) leading to only few IgG molecules sparsely bound on the bacterial cell surface. This scattered profile is insufficient to trigger the activation of the C1 complement complex. Nevertheless, strains can also co-express multiple antigens onto their surface at low levels but at high density (e.g. open pink circles, open blue triangles and filled blue triangle, (C). They can act as a co-target of antibodies being able to work in concert with sub-bactericidal levels of antibodies which ultimately result in bacterial killing. The minimal threshold required for IgG/cell to achieve C1 complex recruitment would therefore be easily met in this condition.