
Figures & data
Table 1. Protective effect of single-gene DNA vaccine against acute infection of Toxoplasma gondiia.
Table 2. Protective effect of single-gene DNA vaccine against chronic infection of Toxoplasma gondiib.
Table 3. Protective effect of multi-gene DNA vaccine against acute infection of Toxoplasma gondiic.
Table 4. Protective effect of multi-gene DNA vaccine against chronic infection of Toxoplasma gondiid.
Table 5. Protective effect of multi-epitope DNA vaccine design base on in silico analysise.
Figure 1. Illustration of common antigens for T. gondii DNA vaccine. The asterisk (*) indicates commonly used antigens.
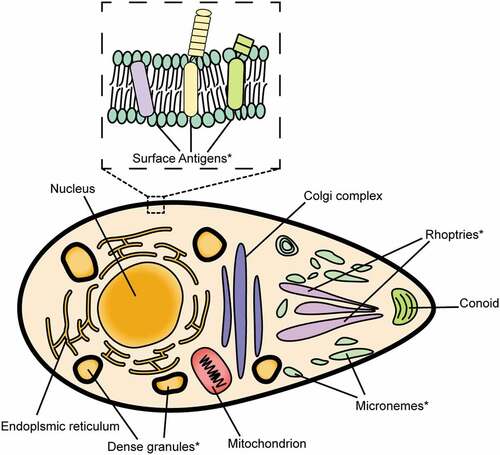
Figure 2. Results of protective efficacy of single-antigen DNA vaccine studies, sorted by antigen type. A, Box plot indicating the average brain cyst reduction rate for each antigen group after chronic challenge. B, Bar chart that counts the number of results that achieve partial protection for each antigen group. C, Box plot indicating the average survival extension in days for each antigen group after acute challenge. D, Box plot indicating the average survival rate (if applicable) for each antigen group after acute challenge. MIC = Microneme proteins; SAG = Surface antigen proteins; GRA = Dense granule proteins; ROP = Rhoptry proteins.
Abbreviations that appeared in the review: