
Figures & data
Table 1. Inclusion and exclusion criteria for the SLR based on the Population, Intervention, Comparator, Outcome, and Study design (PICOS) framework.
Figure 1. PRISMA flow diagram of the SLR for the NMAs.
Figure 2. Network plot of the complete identified network.
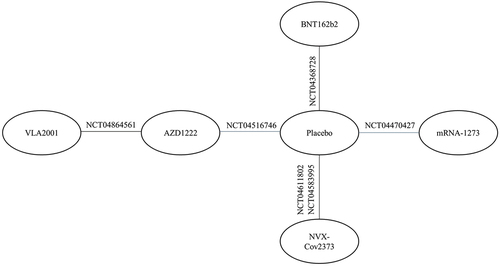
Figure 3. Forest plots for any grade local solicited AE after first dose (A) and second dose (B).
Table 2. SUCRA ranking scores for local AEs of any grade after the first and the second dose.
Figure 4. Forest plots for any grade systemic solicited AE after first dose (A) and second dose (B).
Table 3. SUCRA ranking scores for systemic AEs of any grade after the first and the second dose.
Supplemental material