
Figures & data
Figure 1. Incidences and severity of solicited systemic or local AEs within 7 days following each of the 2 doses of either placebo or the Moderna COVID-19 vaccine.
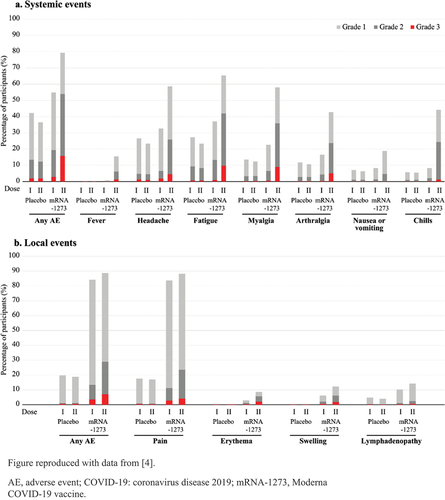
Table 1. Incidences of solicited systemic adverse events within 7 days following vaccination with the recombinant zoster vaccine (RZV) or placebo.
Table 2. Incidences of solicited and unsolicited systemic adverse events within 7 days of the recombinant zoster vaccine (RZV) or placebo.
Table 3. Estimating adverse event (AE) incidence after co-administration vs incidence after single administration of each vaccine, in the absence of enhancement due to co-administration.
Figure 2. Upper limit of the one-sided 95% CI of the true incidence of an event according to the number of participants in the absence of reported cases.
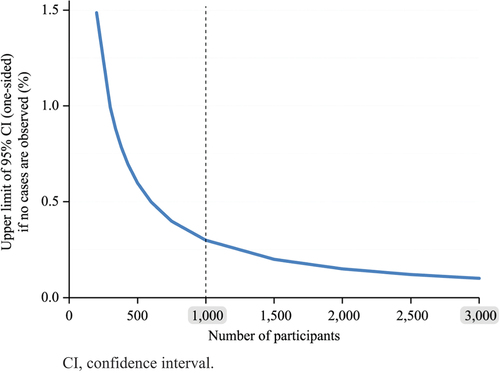
Figure 3. Width of the two-sided 95% confidence interval of the true incidence of an event according to the number of participants and for different observed incidences.
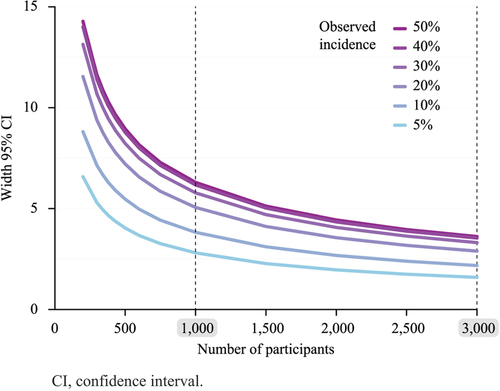
Table 4. Steps to consider during study design, analysis and when updating the label with AE data.