Figures & data
Figure 1. Latin America and the Caribbean Region (LAC) vaccination coverage trends, 2000-2020.
Source: Morice-Trejos et. al [Citation16].
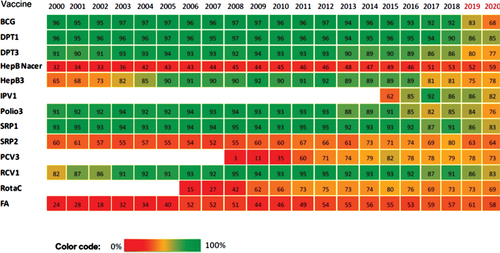
Figure 2. Latin America and the Caribbean Region (LAC) childhood vaccination coverage trends, 2000-2020.
Source: Morice-Trejos et. al [Citation16].
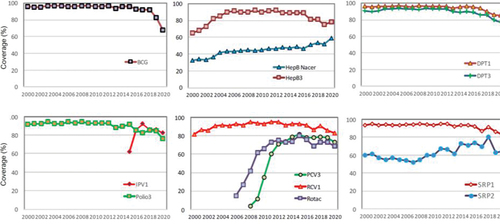
Figure 3. Impact pattern of DTP1 coverage comparing 2018 to 2020 in the Americas.
Source: Morice-Trejos et. al [Citation16].
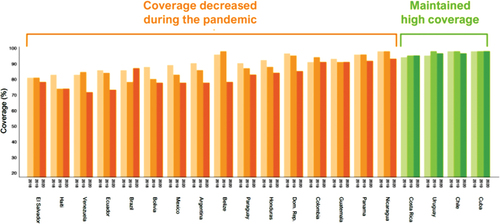
Figure 4. Impact pattern of DPT3 coverage comparing 2018 to 2020 in the Americas.
Source: Morice-Trejos et. al [Citation16].
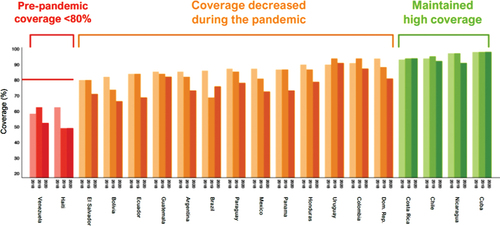
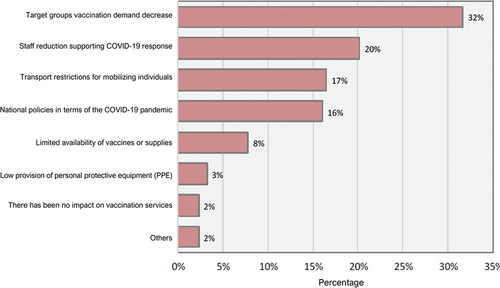
Figure 5. Impact on factors related to immunization services in Latin America and the Caribbean Region (LAC) countries.
Source: Morice-Trejos et. al [Citation16].