
Figures & data
Figure 1. Different vaccination schedules and sample collection. (a) A total of 181 healthy subjects were enrolled in the study. According to the vaccines used for the first vaccination cycle (first two doses) and for the booster (third dose), subjects were divided into six groups (P/P/P, three doses of Pfizer; P/P/M first two doses with Pfizer and booster with Moderna; M/M/P, first two doses with Moderna and booster with Pfizer; M/M/M, three doses of Moderna; A/A/P, first two doses with AstraZeneca and booster with Pfizer; A/A/M first two doses with AstraZeneca and booster with Moderna). The number of subjects included in each group is reported. b) blood samples were collected at the baseline (pre v1), 7 days post first dose (7v1), before the second dose (pre v2), 7, 60 and 130–180 days post second dose (7v2, 60v2 and 180v2), and 7, 30 and 180 days post the third dose (7v3, 30v3 and 180v3). Spike-specific antibodies were assessed at all time points, while RBD-specific B cells were characterized after the third vaccine dose. (P, Pfizer BNT162b2; M, Moderna mRNA-1273; A, AstraZeneca ChAdOx1).
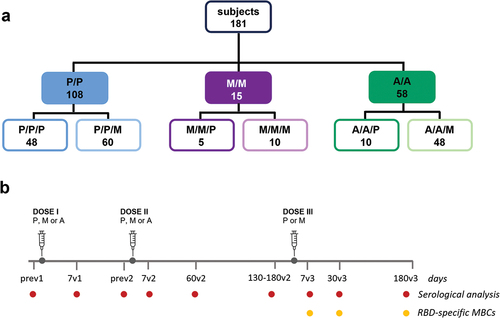
Table 1. Cohort characteristics.
Figure 2. Antibody response in subjects vaccinated with the different SARS-CoV-2 vaccine formulations. (a) longitudinal analysis of spike-specific IgG titers in plasma samples collected at baseline (pre v1), 7 days post first dose (7v1), 7, 60 and 130–180 days post second dose (7v2, 60v2 and 180v2), and 7, 30 and 180 days post the third dose (7v3, 30v3 and 180 v3), in each subjects, in the different 6 groups. The median value of the group is reported as colored line. (b) overlay of the median value of the longitudinal analysis of spike-specific IgG titers in the 6 groups. (c) anti-spike IgG titers assessed after the first , second and third vaccine doses (P, BNT162b2; M, mRNA-1273; A, ChAdOx1). Kruskal-Wallis test, followed by Dunn’s post test for multiple comparisons, was used for assessing statistical differences between groups (*p < 0.05, **p < 0.01, ***p < 0.001). (d) factor increase calculated as the ratio between antibody levels at 7 days after the third dose versus 7 days after the second dose (d7v3/d7v2) or measured at 180 days after third versus 180 days after second dose (d180v3/d180v2). (e) sVNT performed at 180v2 (in groups PP, MM and AA), 30v3 and 180v3 against the wild type RBD performed in the 6 groups (PPP, PPM, MMP, MMM, AAP, AAM) to assess the ACE2/RBD binding inhibition. The threshold (dotted red line) was placed at 30% inhibition percentage to discriminate between positive and negative samples. (f) sVNT performed at 180v3 against the delta (D) and omicron BA.2 RBD. (P/P/P, three doses of Pfizer; P/P/M first two doses with Pfizer and booster with Moderna; M/M/P, first two doses with Moderna and booster with Pfizer; M/M/M, three doses of Moderna; A/A/P, first two doses with AstraZeneca and booster with Pfizer; A/A/M first two doses with AstraZeneca and booster with Moderna), (P, Pfizer BNT162b2; M, Moderna mRNA-1273; A, AstraZeneca ChAdOx1).
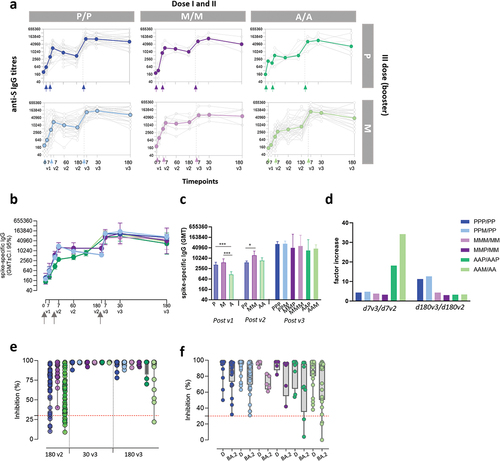
Figure 3. RBD-specific B cells in subjects vaccinated with the different SARS-CoV-2 vaccine formulations (a) Longitudinal analysis of RBD-specific B cells (CD19+CD20+) in samples collected 7, 60 and 180 days post the booster dose (7v3, 30v3 and 180 v3) from each subject in the different 6 groups. The median of the group is reported as colored line. (b) Overlay of the median value of the longitudinal analysis of RBD-specific B cells in the 6 groups. (c) RBD-specific B cells assessed 180 days after the boost does (180v3). Kruskal–Wallis test, followed by Dunn’s post test for multiple comparisons, was used for assessing statistical differences between groups (**p < 0.01, P/P/P, three doses of Pfizer; P/P/M first two doses with Pfizer and booster with Moderna; M/M/P, first two doses with Moderna and booster with Pfizer; M/M/M, three doses of Moderna; A/A/P, first two doses with AstraZeneca and booster with Pfizer; A/A/M first two doses with AstraZeneca and booster with Moderna), (P, Pfizer BNT162b2; M, Moderna mRNA-1273; A, AstraZeneca ChAdOx1).
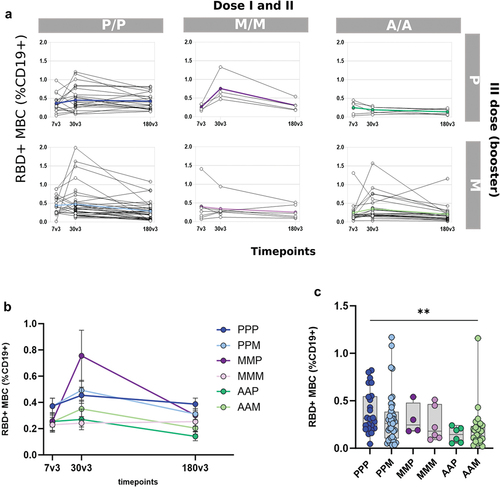
Figure 4. Clustering analysis of RBD-specific B cell subsets in subjects vaccinated with the different SARS-CoV-2 vaccine formulations. FlowSOM algorithm was used to characterize different phenotypes of memory B cells through a clustering analysis. (a) Heatmap of clusters from the FlowSOM analysis of total memory B cells, with IgD, CD27 and CD21 markers in column, and clusters in row. The percentage of cells positive for each marker is visualized with a color scale from blue (0%) to red (100%). A bubble plot reported the percentage of cells included in each cluster. (b and c) Median frequencies, respect to memory B cells, of RBD-specific B cells in each clusters of panel a at 7, 30 and 180 days after the third dose (d7, d30 and d180) in each vaccine formulation reported as heatmap (b) and dot plot (c). (P/P/P, three doses of Pfizer; P/P/M first two doses with Pfizer and booster with Moderna; M/M/P, first two doses with Moderna and booster with Pfizer; M/M/M, three doses of Moderna; A/A/P, first two doses with AstraZeneca and booster with Pfizer; A/A/M first two doses with AstraZeneca and booster with Moderna), (P, Pfizer BNT162b2; M, Moderna mRNA-1273; A, AstraZeneca ChAdOx1).
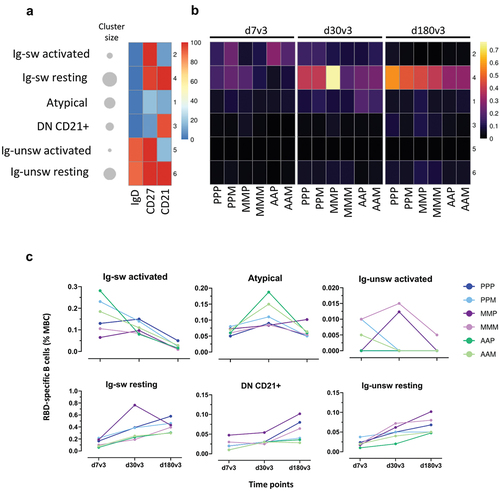
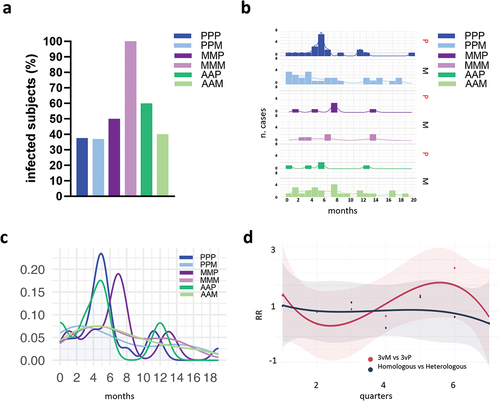
Figure 5. Cases of infection across the different SARS-CoV-2 vaccine formulations. (a) Frequency of subjects reporting infection after the booster dose, across the different vaccine combinations. (b) Number of infections over time, reported in months since the third dose of vaccination, for each vaccine combination. Booster with Pfizer (P) or mRNA-1273 (M) are shown on the right. (c) Smooth fit of infection distributions over time for each of the six combinations of vaccines. Density values are obtained by normalizing the number of cases to the total number of infected individuals within each group. (d) Trend of relative risk (RR) of infection for the comparisons of groups that received BNT162b2 or mRNA-1273 as booster dose (3vM vs 3vP, red curve) and homologous vs heterologous (dark blue curve). The two trends are fitted using a cubic spline model and time is reported as quarters since the booster dose. (P/P/P, three doses of Pfizer; P/P/M first two doses with Pfizer and booster with Moderna; M/M/P, first two doses with Moderna and booster with Pfizer; M/M/M, three doses of Moderna; A/A/P, first two doses with AstraZeneca and booster with Pfizer; A/A/M first two doses with AstraZeneca and booster with Moderna), (P, Pfizer BNT162b2; M, Moderna mRNA-1273; A, AstraZeneca ChAdOx1).
Data availability statement
Data available upon request.