
Figures & data
Figure 1. PRISMA (Preferred Reporting Items for Systematic Reviews and Meta-Analyses) flow diagram.
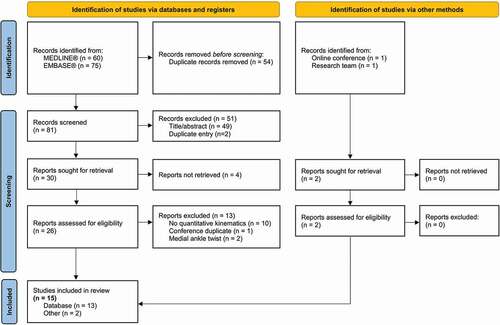
Table 1. Chronological list of studies, case numbers and individual’s characteristics
Figure 2. Peak ankle joint angle (a, d, g), time to peak ankle joint angle (b, e, h), and peak ankle joint velocity (c, f, i) of the case reports with respect to each study. Adapted and updated based on (Fong et al., Citation2021).
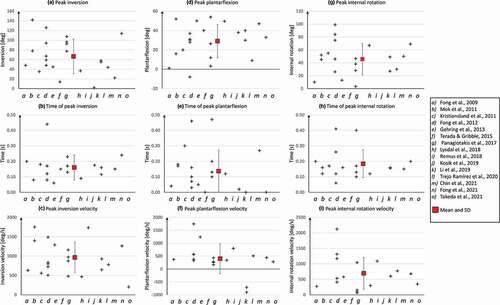
Table 2. Summarising table of initial contact ankle joint angles and shoe-surface contact location
Table 3. Summarising table of peak ankle joint kinematics
Figure 3. Scatterplot of total ankle joint displacement angle (y-axis) and time to peak displacement (x-axis). The homogenous linear function illustrates the correlation between total joint displacement and time from initial contact to peak joint displacement.
Figure 4. The two phases of the non-contact ankle inversion twist.
Table 4. Summarising table of peak ankle joint kinetics
Table 5. Case distinction
Supplemental Material
Download Zip (104.5 KB)Supplemental Material
Download MS Word (21 KB)Supplemental Material
Download MP4 Video (139 MB)Data availability statement
The authors are happy to share the data upon reasonable request.