
Figures & data
Table 1. Participants' Characteristics.
Figure 1. Footwear and marker placement on the children's bodies: (a) barefoot, (b) minimalist shoe and (c) standard running shoe.
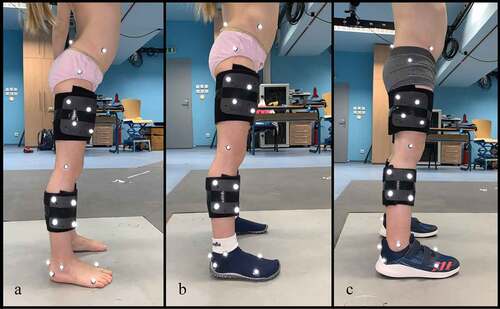
Figure 2. Vertical ground reaction force (VGRF) during the stance phase: (A) 3-year-old, (B) 4-year-old, (C) 5-year-old and (D) 6-year-old children. Data are presented as mean and standard deviation (SD). Statistical parametric mapping (SPM)—vertical ground reaction force during first 50 % of the stance phase. Initial analysis: One-way repeated measures ANOVA (SPM (F)). Post hoc analysis: Paired, two-tailed t-test (SPM (t)). Abbreviations: B–barefoot, BW–body weight (%), M–minimalist shoes and SRS–standard running shoes.
Figure 3. Maximal vertical instantaneous loading rate. One-way repeated measures ANOVA. Pairwise comparison of three footwear conditions in each age group. Data are presented as mean standard deviation (SD). Abbreviations: B–barefoot, BW–body weight, M–minimalist shoes and SRS–standard running shoes. Significant differences: *B-M, #B-SRS, with Bonferroni correction. *p < 0.050, ** p < 0.010, *** p < 0.001, # p < 0.05, ## p < 0.010 and ### p < 0.001.
Table 2. Secondary outcome (footstrike pattern—categorisation according to the strike index) and control variables (dimensionless speed).
Data availability statement
This article has been posted as a preprint in Research Square (DOI: 10.21203/rs.3.rs-1054040/v1). The data that support the findings of this study are available from the corresponding author [JP] upon reasonable request.