
Figures & data
Figure 1. Representation of the 90–90 isometric assessment.
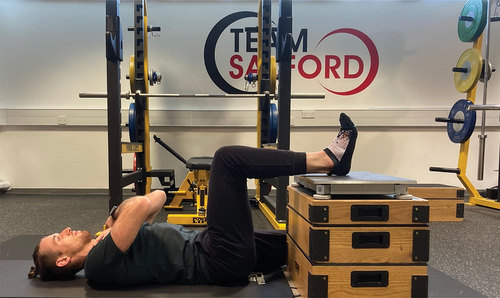
Table 1. Between session mean, standard deviation (SD), absolute and relative reliability and absolute and relative (%) measurement error scores.
Figure 2. (a,b) Scatterplots with linear trend line and 95% CI, Pearson’s correlation coefficient (r) with 95% CI and coefficient of determination (R2) with percentage of explained variance illustrating the relationship between peak force and (a) force at 100 ms, (b) force at 200 ms.
Figure 3. (a,b) Scatterplots with linear trend line and 95% CI, Pearson’s correlation coefficient (r) with 95% CI and coefficient of determination (R2) with percentage of explained variance illustrating the relationship between peak force and (a) aRFD over 100 ms and (b) aRFD over 200 ms.
Data availability statement
The data that support the findings of this study are available from the corresponding author, upon reasonable request.