Figures & data
Figure 1. Three applicator tips used in this study along with treatment sites used. (a) 5 × 5 mm tip; (b) 2.5 × 2.5 mm tip; (c) 1.5 × 1.5 mm tip; (d) treatment sites used in first cohort of three patients; (e) treatment sites used in second cohort
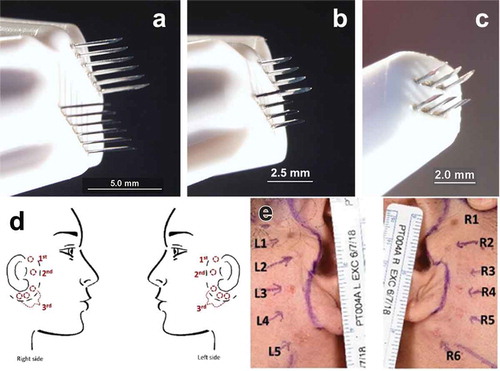
Figure 2. Long-term images of facial skin treated with NPS energy. (a) Fitzpatrick type 1 skin treated with 150 mJ/mm3; (b) Fitzpatrick type 2 skin treated with 150 mJ/mm3. (c) Fitzpatrick type 1 skin treated with 300 mJ/mm3; (d) Fitzpatrick type 2 skin treated with 300 mJ/mm3. The scale bars in each image are 2 mm long and the day after treatment on which each photo was taken is indicated in the upper left of each photo
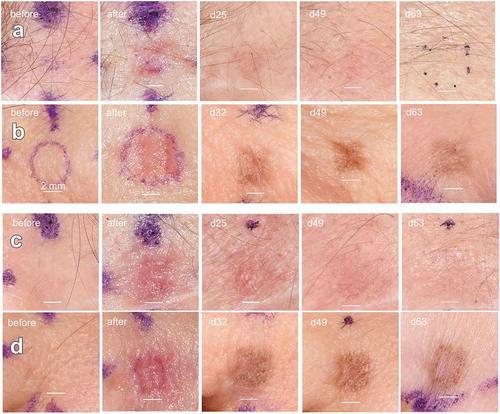
Figure 3. H&E histology of the changes in facial skin following NPS treatment using an energy setting of 500 mJ/mm3 with a 1.5 × 1.5 mm applicator. (a) Untreated facial skin biopsy from patient 5; (b) biopsy of facial skin from patient 5 one day after NPS treatment. Ghost cells lacking nuclear stain are present in the epidermis; (c) biopsy of facial skin from patient 5 one week after NPS treatment. Note the formation of an eschar (arrow) resulting from the treated epidermis in “(b)” (ellipse) and the newly regenerated, thinner epidermis that has formed on the dermis; (d) biopsy of facial skin from patient 5 thirty days after NPS treatment; (e) control facial skin sample from patient 5; (f) skin biopsy from patient 5 taken 1 day post NPS treatment. Arrows point to sebaceous glands undergoing regulated cell death. SK indicates a necrotic seborrheic keratosis that was present on treated skin
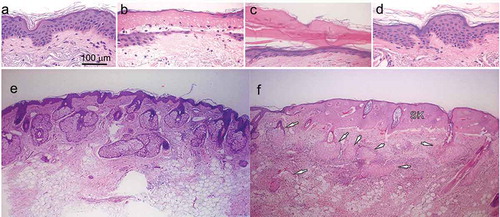
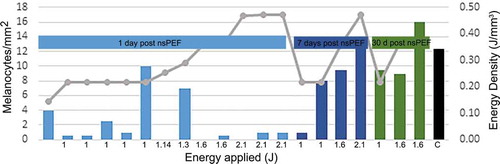
Figure 4. Mean melanocyte density determined in preauricular tissue samples treated with a 2.5 × 2.5 mm tip, applying indicated energies and scored at indicated sample time. Bars indicate melanocyte density and gray line indicates the energy density that was applied. Total applied energy is indicated below each bar