Figures & data
Table 1. Baseline characteristic
Table 2. Comparison before and after therapy
Figure 1. Clinical SA lesions in study subjects in 0.1% tretinoin single-therapy, pre-therapy (A) and post-therapy (B)
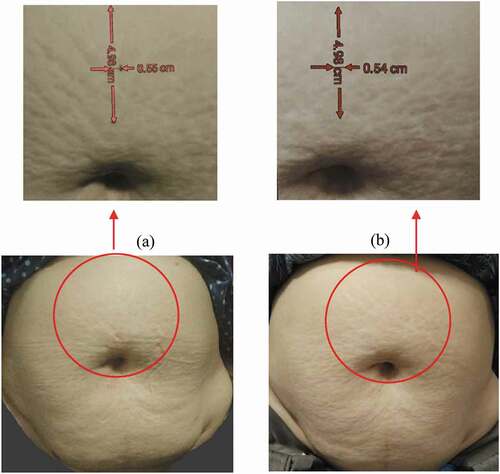
Figure 2. Clinical SA lesions in study subjects in the combination therapy group FMR + fractional CO2 laser, pre therapy (A) and post therapy (B)
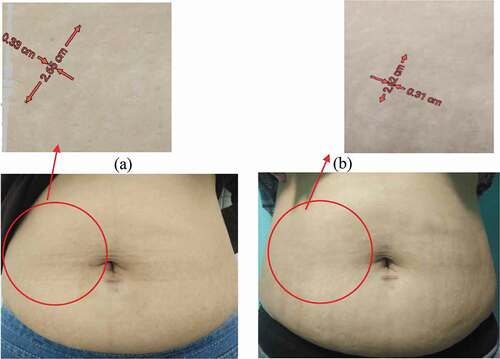
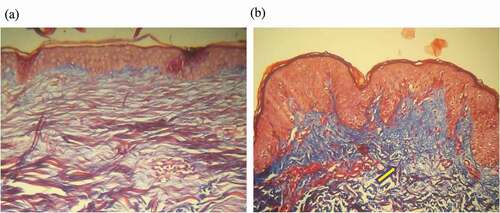
Figure 3. Histopathology of the percentage area of collagen (100x magnification) in the study subjects in the 0.1% tretinoin cream group, pre therapy (A) and post therapy (B). Yellow arrows indicate an increase in the amount of collagen
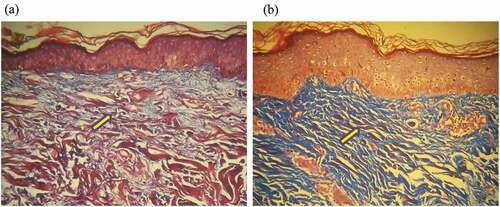
Figure 4. Histopathology of the percentage area of collagen (100x magnification) in the study subjects in the combination therapy group FMR + fractional CO2 laser, pre therapy (A) and post therapy (B). Yellow arrows indicate an increase in the amount of collagen