Figures & data
Table 1. Definitions of variables.
Table 2. Summary statistics of the full sample.
Table 3. Correlation matrix of the full sample.
Figure 1. The distribution of the year when firms (in this study) made carbon neutrality commitments.
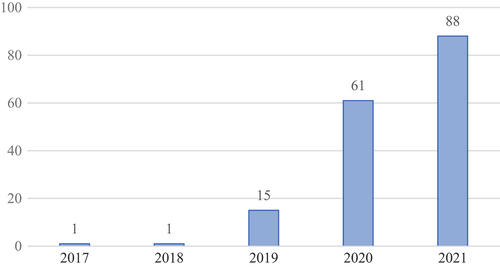
Figure 2. The distribution of the target year when countries plan to reach carbon neutrality (by 8th June 2021).
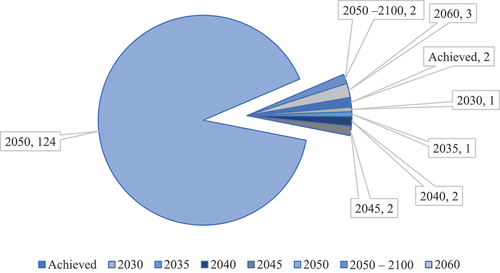
Figure 3. The distribution of national measures to realise carbon commitment (by 8th June 2021).
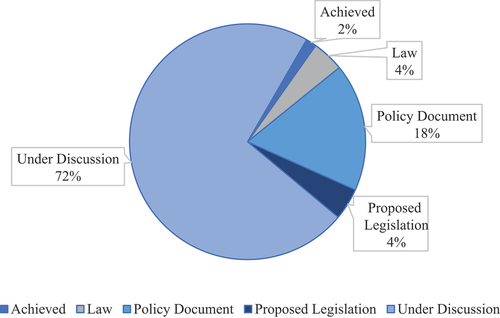
Table 4. Between-group summary statistics by country.
Figure 4. The distribution of the target year when firms (in this study) plan to reach carbon neutrality.
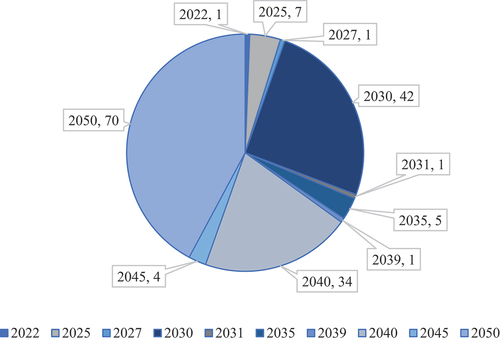
Table 5. Between-group summary statistics of variables by goal.
Table 6. Market reaction to carbon neutrality commitments (full sample).
Figure 5. Market reactions to carbon neutrality commitments in different event windows.
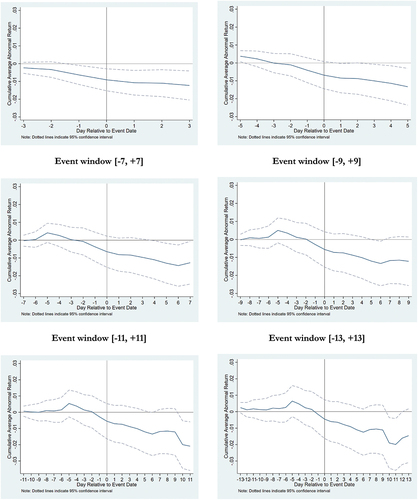
Table 7. Market reaction to carbon neutrality commitments (by country).
Figure 6. Market reactions to carbon neutrality commitments in different event windows by country.
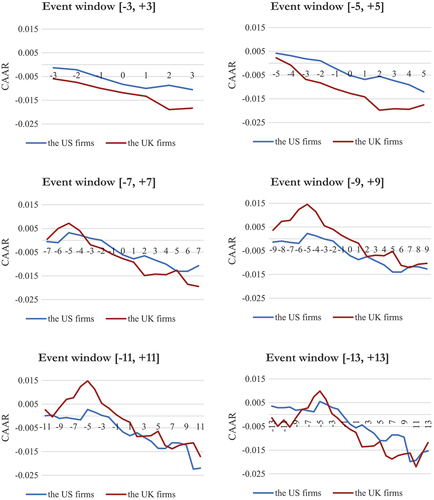
Table 8. Market reaction to carbon neutrality commitments (by goal).
Figure 7. Market reactions to carbon neutrality commitments in different event windows by goal.
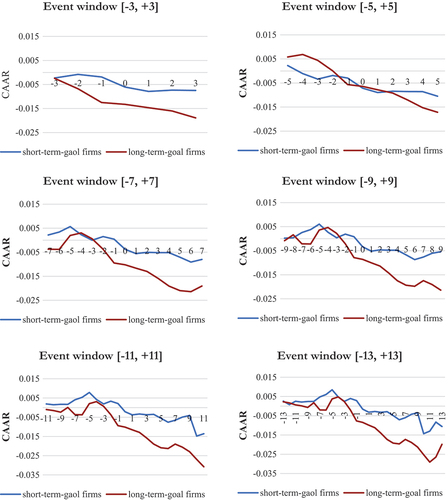
Table 9. Regression analysis of CAR.
Table 10. Robust checks with carbon neutrality goal types.
Table 11. Robust checks in the event window [−3, +3] and [−7,+7].
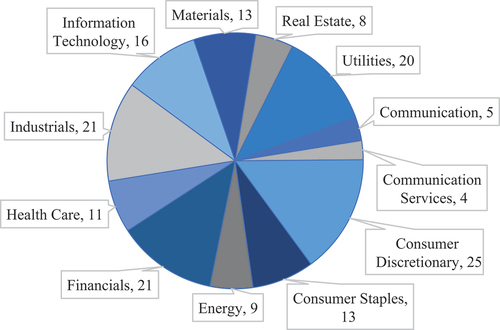
Figure A1. The industry distribution of firms (in this study).