Figures & data
Figure 1. Monthly average disposable income per capita in single retirees’ households and average gross retirement pension from non-agricultural social security system compared in PLN. Surce: Own study based on (Central Statistical Office, Citation2019).
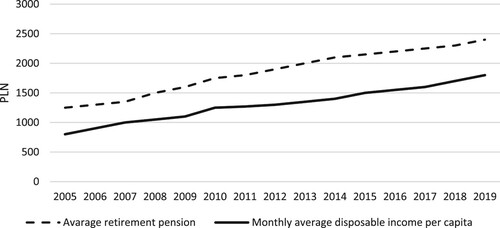
Table 1. Dendrogram clusters division into groups.
Table 2. Responses regarding reasons for tourist migration.
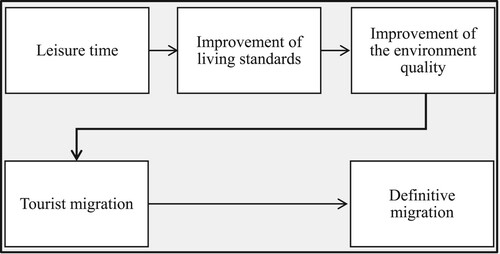
Figure 2. Scheme of the process of seniors’ migration in the tourist aspect. Source: own elaboration