Figures & data
Table I. Demographic and clinical characteristics of the study population.
Table II. Maternal plasma concentration of anti-protein Z antibodies.
Figure 1. Maternal plasma concentrations of anti-protein Z anti-bodies in non-pregnant and pregnant women.
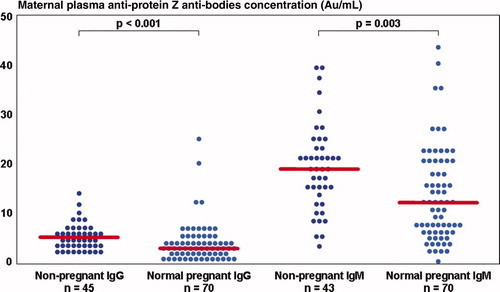
Figure 2. The association between maternal plasma anti-protein Z IgM antibodies and gestational age at blood collection.
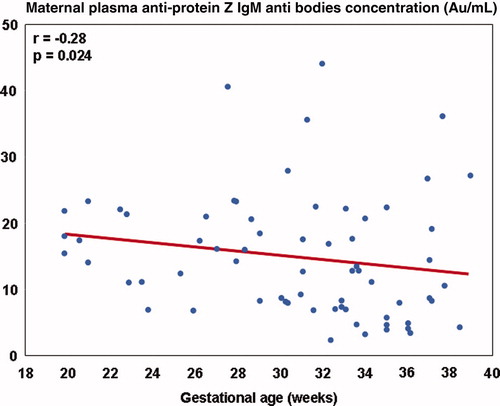
Figure 3. Maternal plasma concentrations of anti-protein Z antibodies in normal and complicated pregnancies.
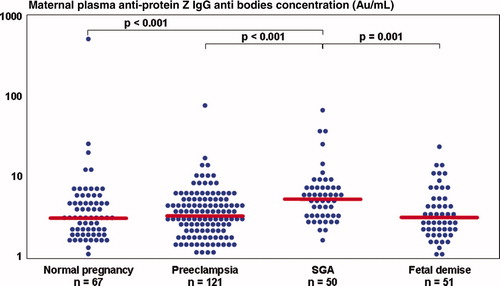
Table III. Comparison of IgG anti-protein Z antibodies percentiles between the study groups.
Table IV. Comparison of IgM anti-protein Z antibodies percentiles between the study groups.