Figures & data
Table 1. Clinical characteristics of asphyxiated newborns with normal and abnormal outcome.
Table 2. Comparison of maternal and neonatal parameters between the two groups of asphyxiated infants with normal and abnormal outcomes unite: n (%).
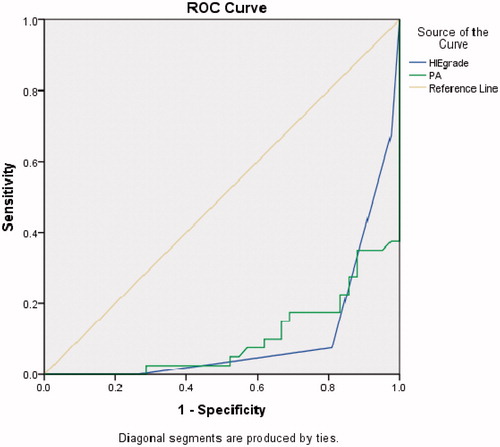
Figure 1. ROC curve for HIE, PAB, and other indicators for determining outcomes in asphyxiated babies.