Figures & data
Table 1. Comparison of the average of maternal and neonatal clinical parameters in asphyxiated *neonates with favorable and unfavorable outcomes.
Table 2. Comparison of some maternal and neonatal variables in the two groups of asphyxiated neonates with favorable and unfavorable outcomes.
Table 3. Comparison of the combination of indicators that predict the risk of unfavorable prognosis.
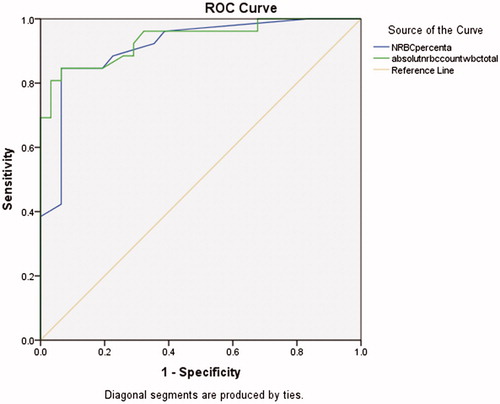
Figure 1. ROC curve for comparison of sensitivity and specificity of NRBC and absolute NRBC count in asphyxiated neonates, to determine the prognosis in 24 months.