Figures & data
Figure 1. Flow cytometry dot plots of in vitro-formed immune complexes. Immunoglobulin complex detection is shown from (A) to (D), and C3d complement deposition is shown from (E) to (H) on umbilical cord erythrocytes. Left panels correspond to isotype controls and right panels with human secondary antibodies. (A) and (B) dot plots depict simultaneous detection of IgG and IgM complexes. (C) and (D) dot plots simultaneous detection of IgA and IgG complexes. (F) and (H) dot plots show C3d deposition on independent IgM and IgG complexes, respectively; (E) and (G) controls with decomplemented serum. IgG complexes were formed with anti-Rh serum containing antibodies on Rh+, IgM complexes were formed with anti-AB serum on AB and IgA complexes were formed with human IgA added to acid tannic-treated erythrocytes.
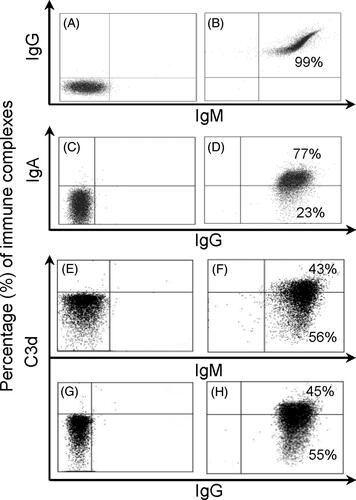
Table 1. Characteristics of the population studied.
Figure 2. Detection of immune complexes in umbilical cord erythrocytes. (A) Median and interquartile range of immune complexes percentages from all samples. (B) Median and interquartile ranges of erythrocytes cells carrying IgG complexes according to the delivery route and (C) IgM complexes. Mann–Whitney U test was used to obtain p values.
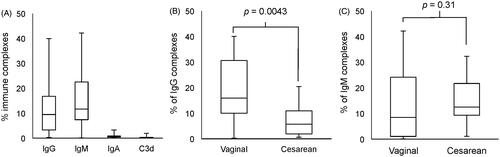
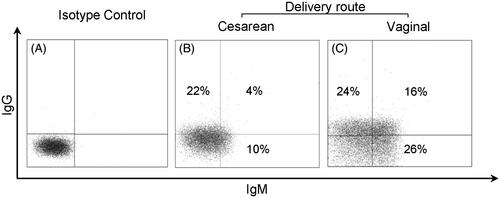
Figure 3. Flow cytometry dot plot examples. Dot plot flow cytometry analysis of Isotype control (A), sample from cesarean delivery (B) and (C) vaginal delivery sample. As mentioned, comparing vaginal and cesarean delivery, there was a difference for IgG complexes (p = 0.0043), but not in IgM complexes (p = 0.31).