Figures & data
Table 1. Clinical characteristics of obese and normal-weight women and their offspring.
Figure 1. Mean weight z-scores ± SEM from birth until 48 months of age in children born to obese (OB) and normal-weight (NW) mothers.
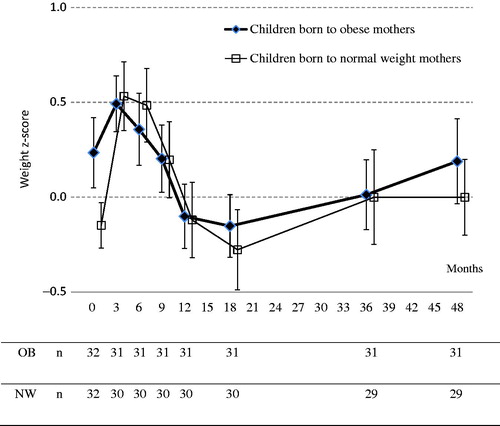
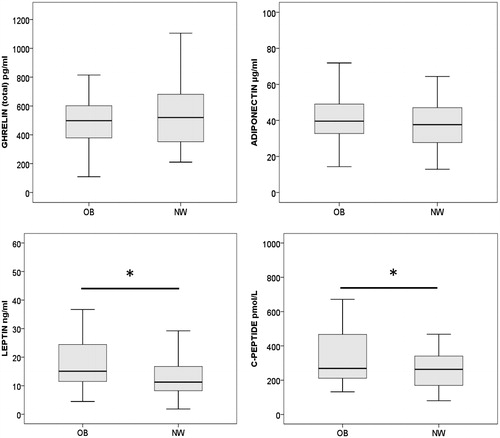
Figure 2. Box plots of ghrelin, adiponectin, leptin, and C-peptide concentrations in cord blood from children born to obese and normal-weight women. The boxes represent the interquartile range, the horizontal bars are the median, and whiskers are the range. *The leptin and the C-peptide concentrations were significantly higher in infants born to obese mothers (p = .016 and p = .027, respectively). OB: obese mother; NW: normal-weight mother.